Learn to get more comfortable with DevTools
If you're a web developer, DevTools Tips is for you! Whatever your level of experience, and whatever browser you
prefer using for web development, use DevTools Tips to learn new tips and tricks on a regular basis.
Get tips delivered to your favorite news reader by using our RSS feed.
There are currently 183 tips (and we're adding more all the time) available thanks to all of our wonderful
open-source contributors.
If you know other debugging techniques and tips not documented here, submit a new tip on our
GitHub repository!
Latest tips
-
Override network responses with local files
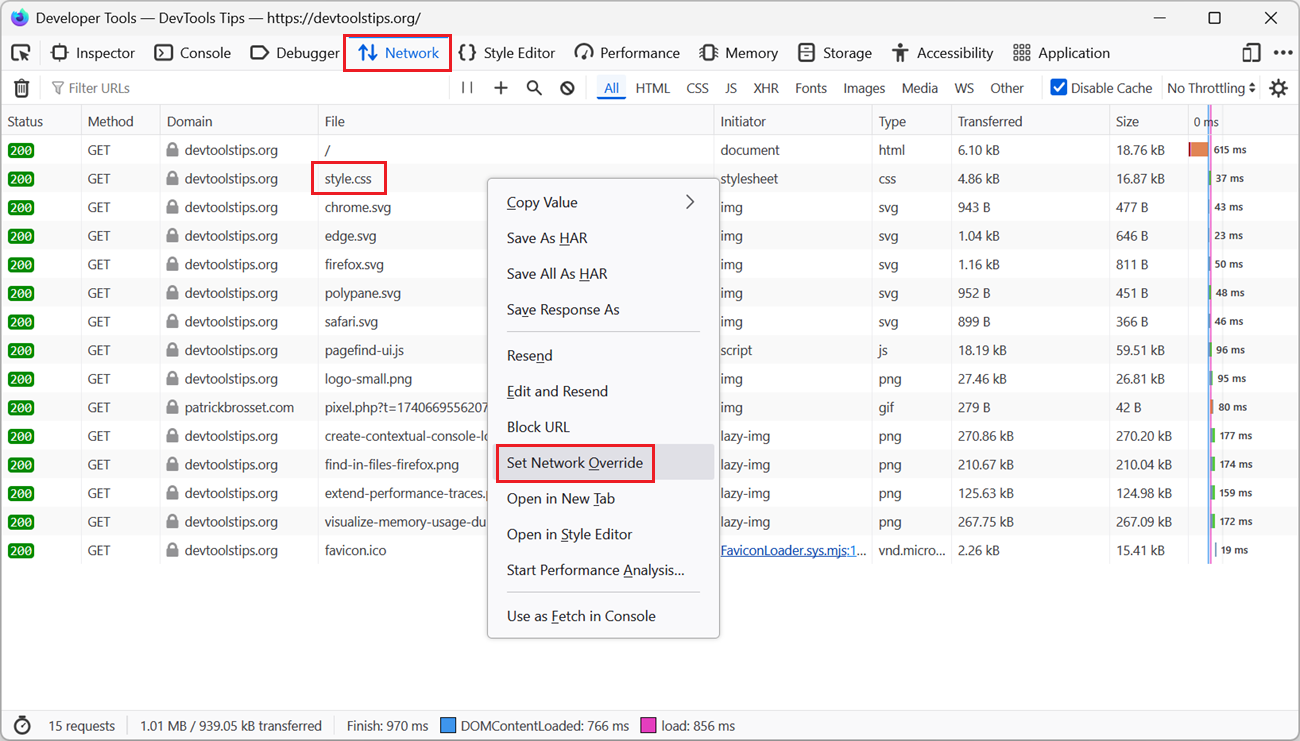 To test a quick fix locally, in DevTools, without editing the source file and deploying it to a server, override network responses with local files. Firefox # Open the Network tool. Find the reque... Read more
 -
Create contextual console loggers
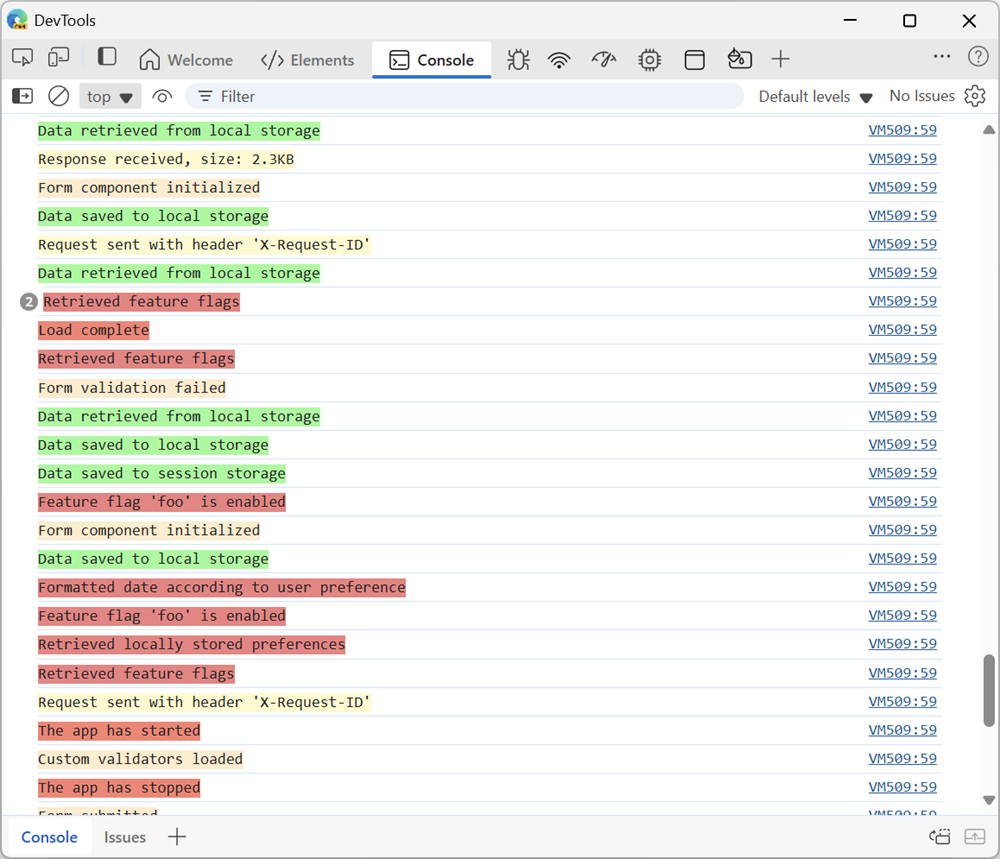 Applications are often made up of multiple subsystems or components, each with its own set of log messages. When you're debugging such an application, it might be hard to find the logs you're looking... Read more
 -
Find in files
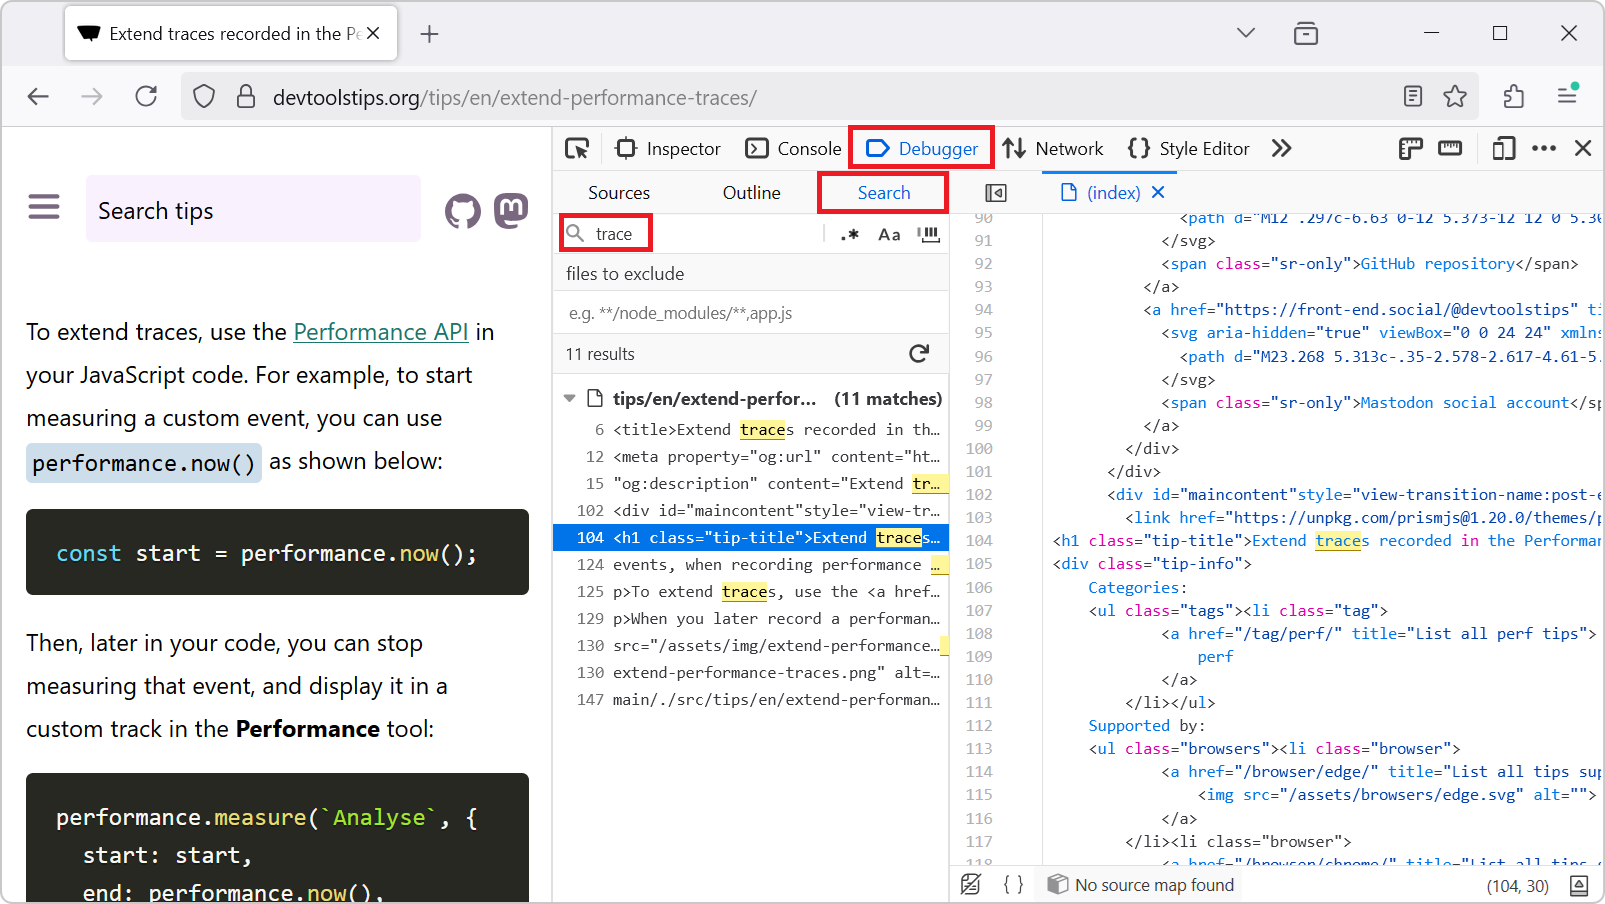 To find occurrences of a string in all of the files of the webpage you are inspecting, for example to find where a specific CSS class is defined, or where a specific JavaScript API is used: In Firef... Read more
 -
Extend traces recorded in the Performance tool with your own custom data
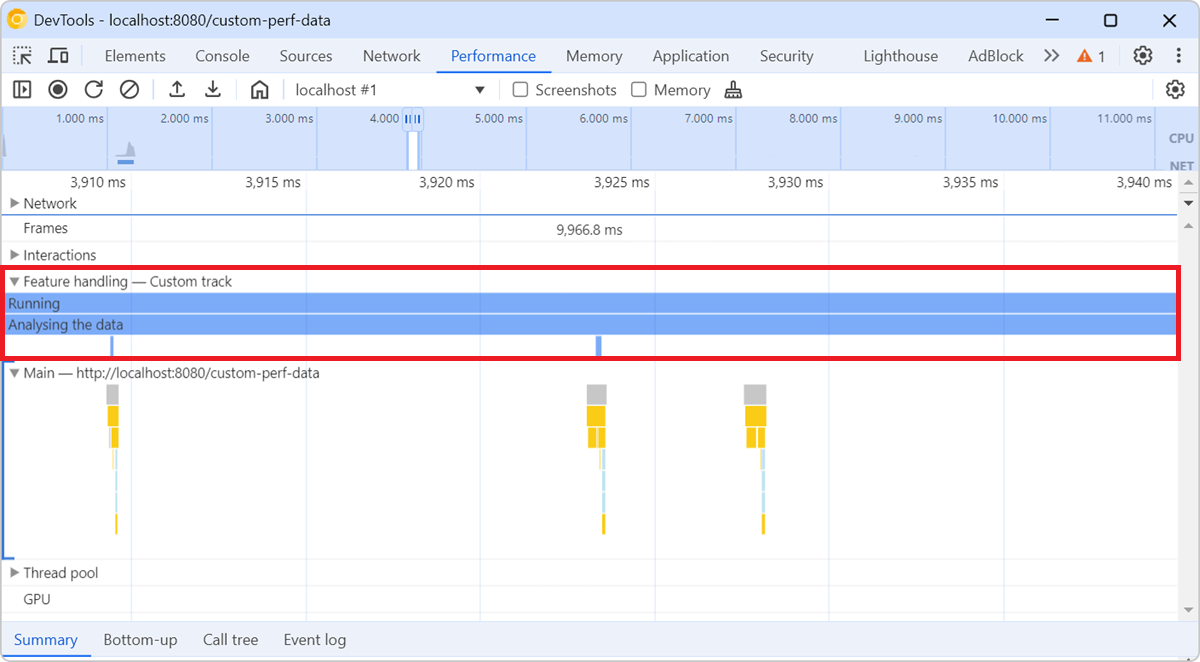 The Performance tool lets you add custom tracks with your own custom events, when recording performance traces. This is useful to surface your own performance data, which might not map directly to the... Read more
 -
Visualize a webpage's memory usage during a performance recording
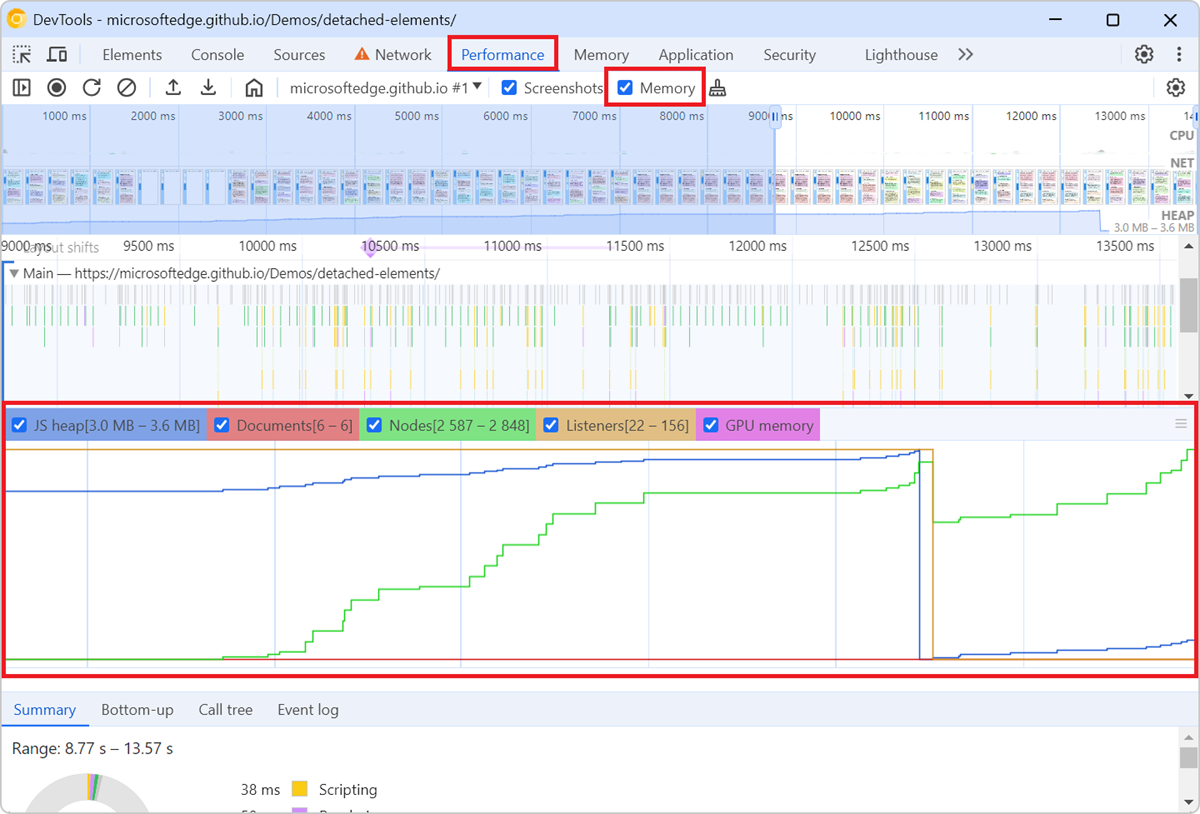 To check how much memory a webpage consumes over the time of a specific user scenario, and to identify potential memory leaks, you can use the Memory tool in Chrome or Edge DevTools with the Memory op... Read more
 edge
edge
 chrome
 firefox