edge
edge
 chrome
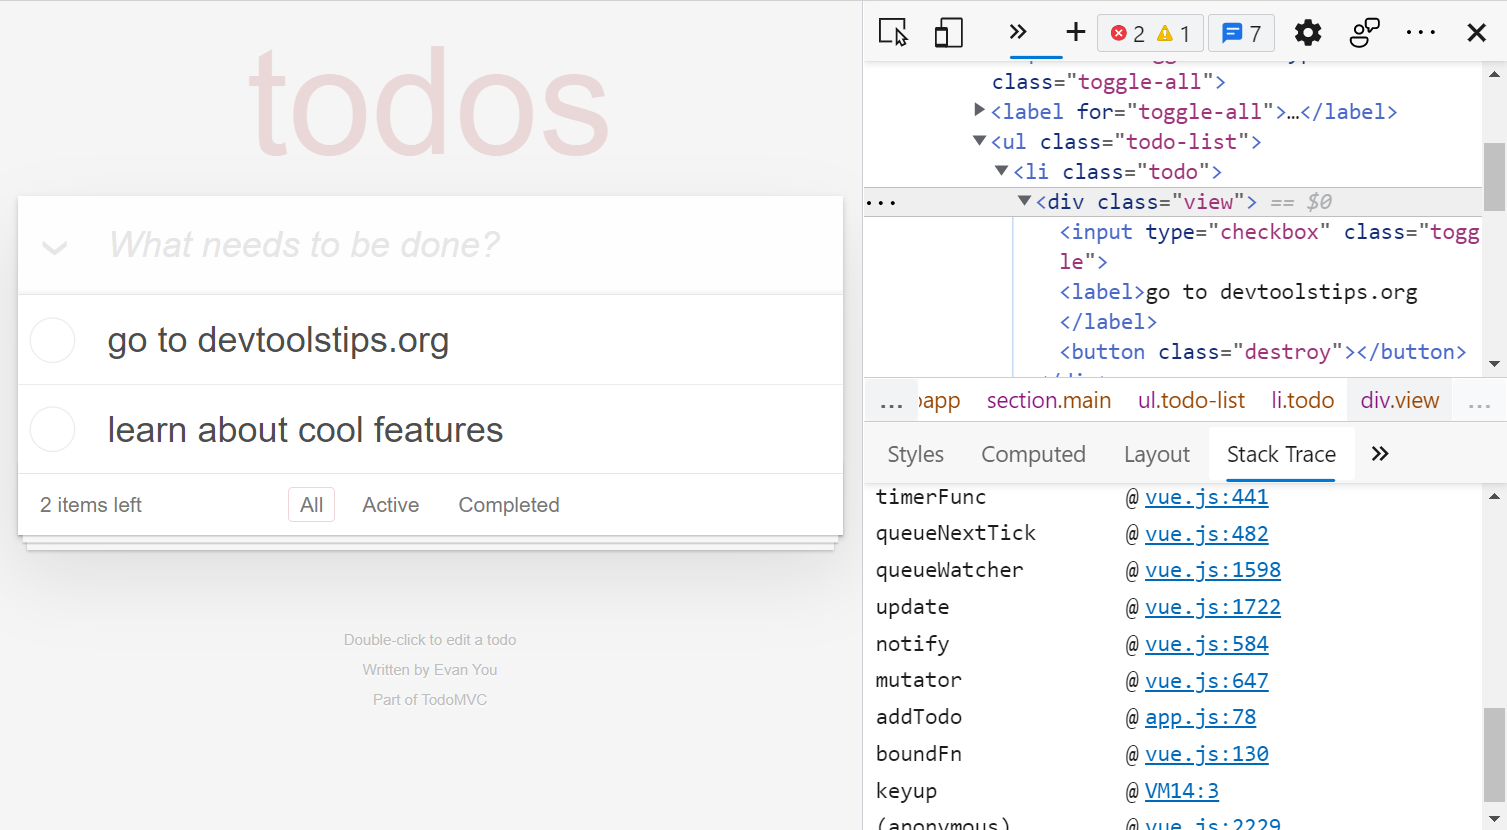
Have you ever wanted to know what caused a specific DOM node or element to be created in the page?
When working on a site that uses a lot of JavaScript and especially when you don't know the codebase, this can be a life saver.
It turns out there is a way to do this automatically without having to set breakpoints in the code at all. It is a hidden experiment for now so you will need to first enable it in Chrome or Edge.
-
Go through the following steps once to enable the experiment:
- Go to the DevTools settings (press F1, or use the gear icon in the toolbar)
- Go to the Experiments tab
- Check the Capture node creation stacks box
- Reload DevTools
-
Make sure DevTools is opened when using the website so that stack traces get captured. When you want to know what created a node:
- Select the node in the Elements panel
- In the sidebar, select the Stack Trace panel (you might have to first click on the More tabs chevron
>>to see the tab) - The stack of JavaScript calls that led to the node creation (if any) should be displayed.