firefox
 chrome
 edge
edge
 safari
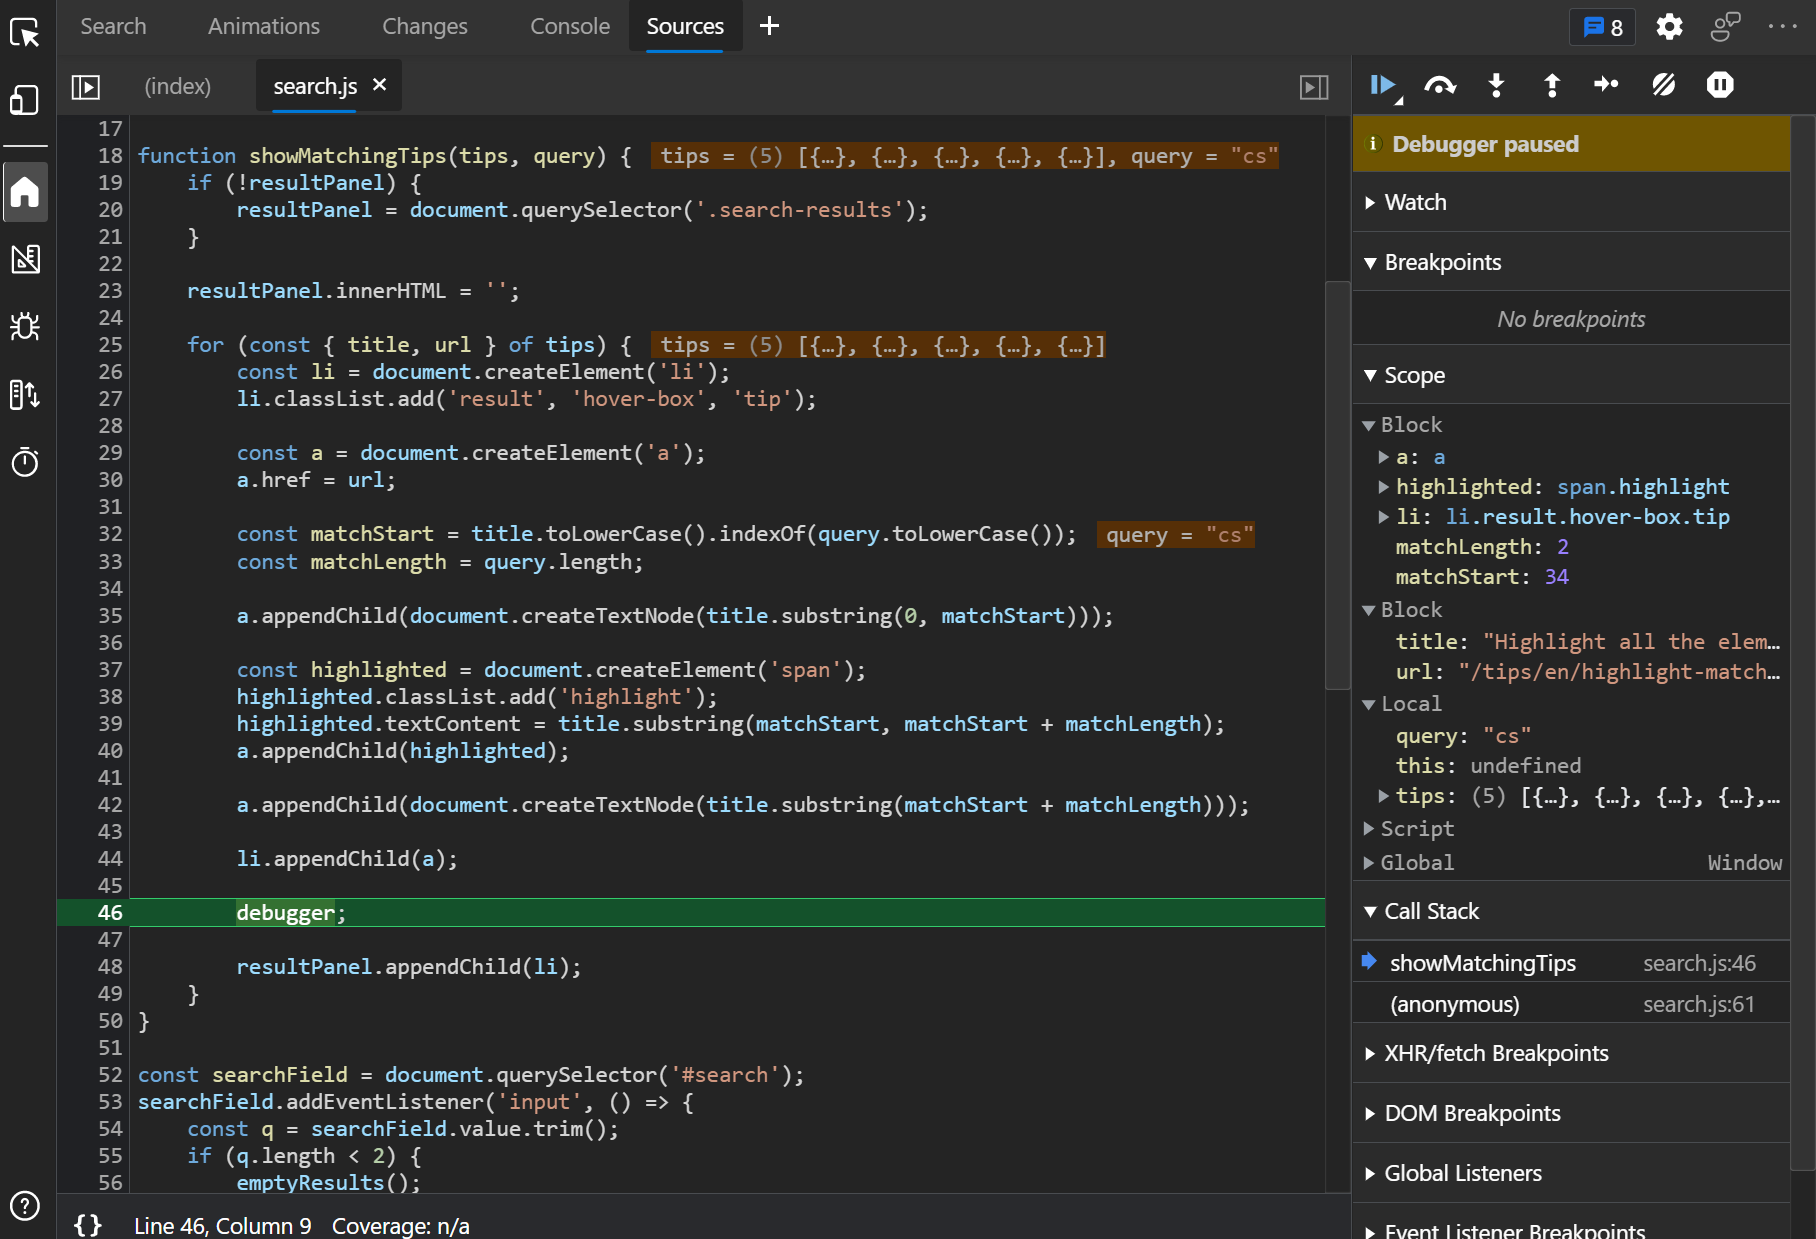
If you prefer to use console.log() statements rather than the JavaScript debugger because you find it difficult to set breakpoints in DevTools (or you can't), then you can use the debugger statement in JavaScript.
- Where you normally add a
console.log(), add adebugger, directly in the code - Open DevTools on your page
- Trigger the action that will make your code run
- The Sources panel (or Debugger panel in Firefox) will automatically open up, and pause script execution at that line, giving you a chance to see what are the values of local variables, the callstack, etc.