edge
edge
 chrome
 firefox
 safari
If the page you are working on contains an iframe which you want to inspect and debug, you can actually use DevTools to do so. This can be very useful when working with coding playground sites like CodePen, JSFiddle, or Glitch.
Firefox #
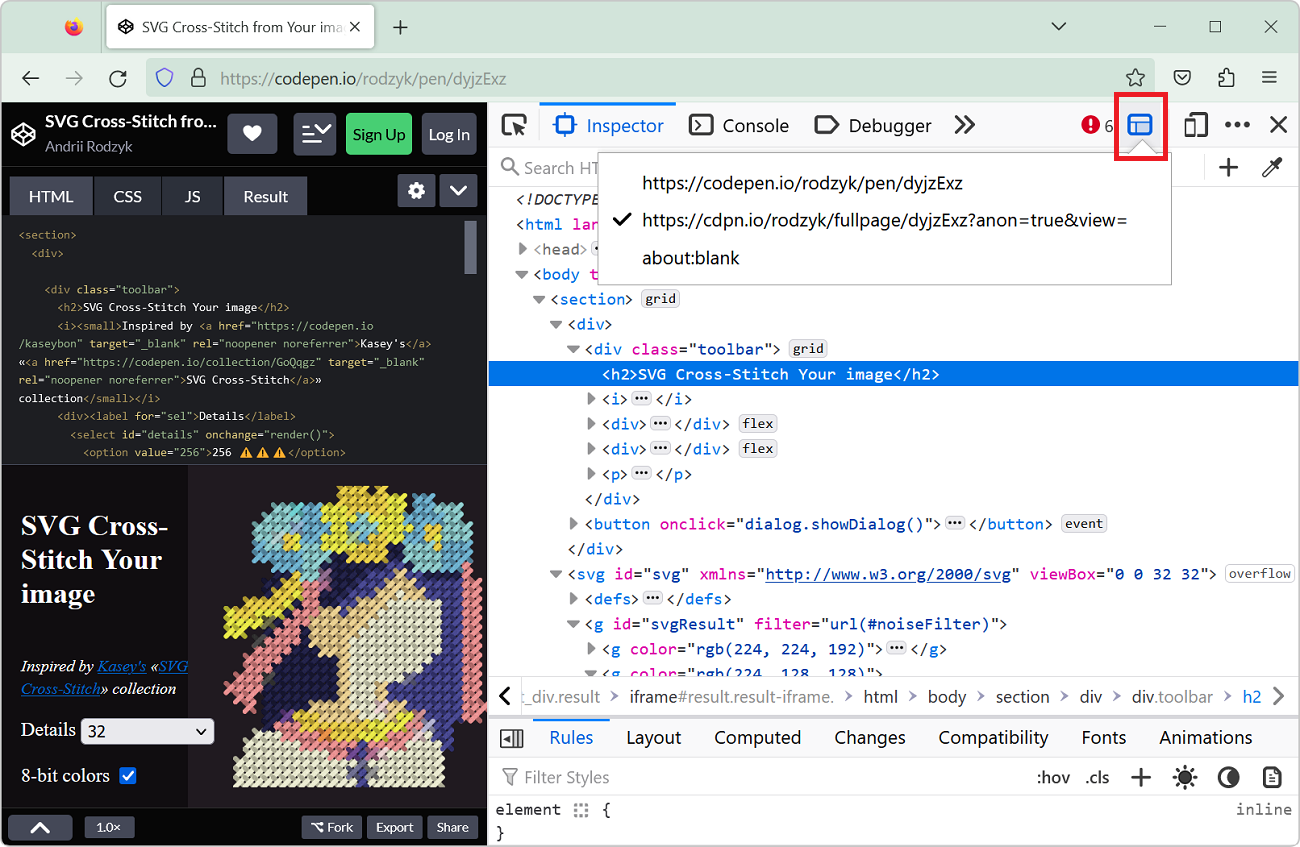
Firefox has an iframe selector button in its toolbar that lets you select the iframe you want to inspect. Once selected, the Inspector and Console tools will be scoped to the iframe you selected. This means that you will only see the DOM tree and the console messages for the iframe you selected. This also means that any JavaScript expression you execute in the Console tool will be executed in the context of the iframe.
- Open Firefox DevTools.
- In the main toolbar, click Select an iframe as the currently targeted document.
- Select the iframe you want to inspect.
Chrome, Edge, Safari #
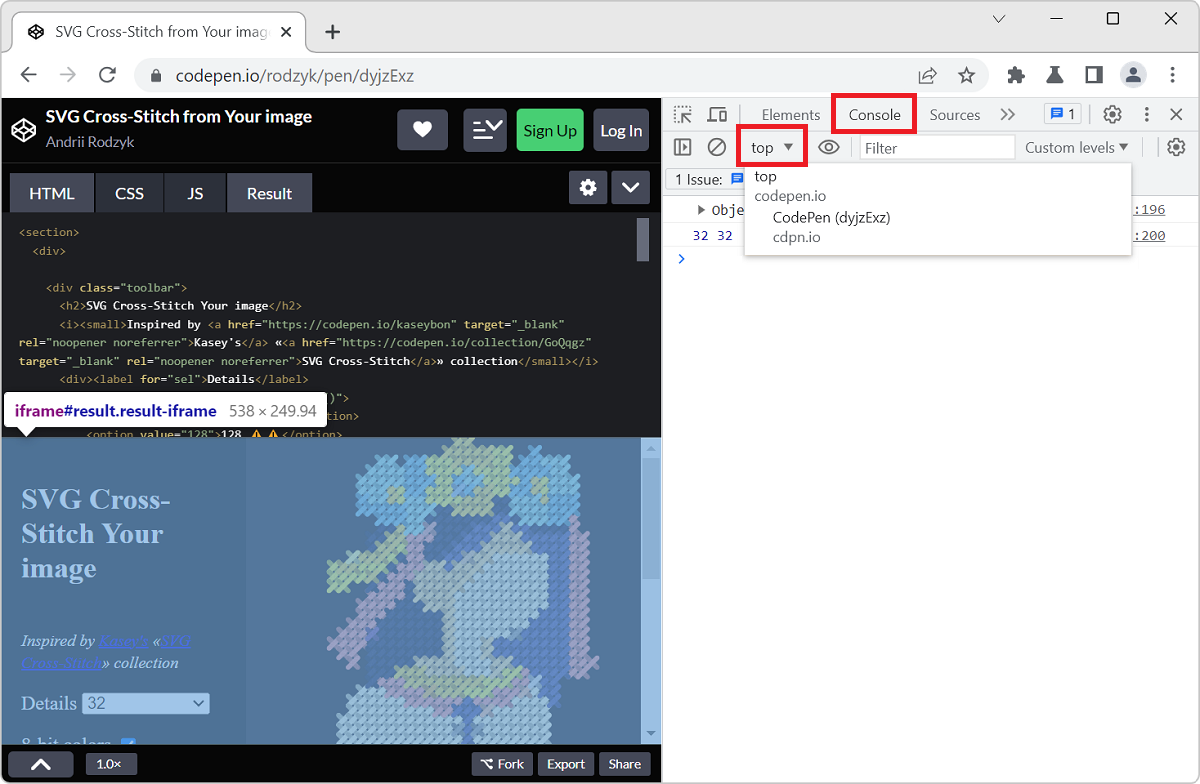
Chromium-based browsers and Safari have a JavaScript context selector button located in the Console tool which allows you to select the iframe you want to execute JavaScript expressions in. This button does not change what's visible in the Elements tool, it only changes the JavaScript context in which the Console tool works.
- Open DevTools.
- Open the Console tool.
- In the Console toolbar, click JavaScript context.
- Select the context you want to execute JavaScript expressions in.