edge
edge
 chrome
To check how much memory a webpage consumes over the time of a specific user scenario, and to identify potential memory leaks, you can use the Memory tool in Chrome or Edge DevTools with the Memory option.
-
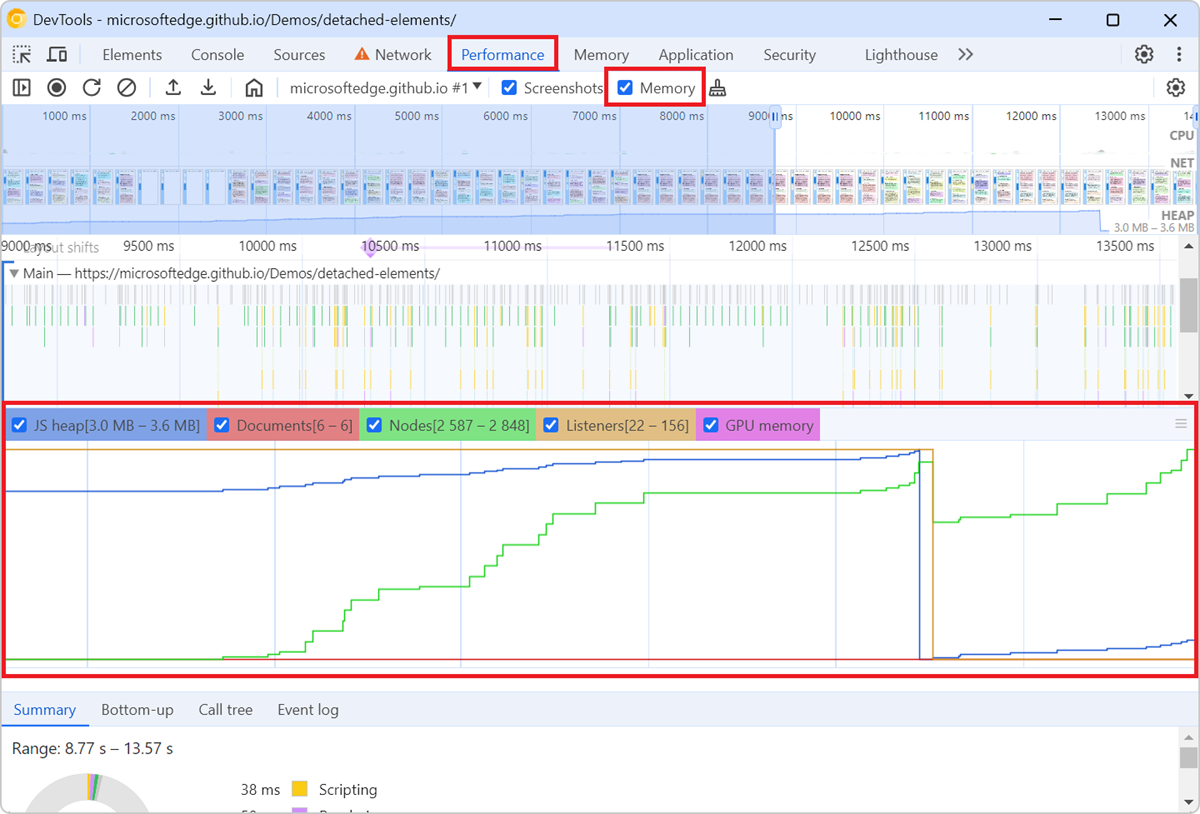
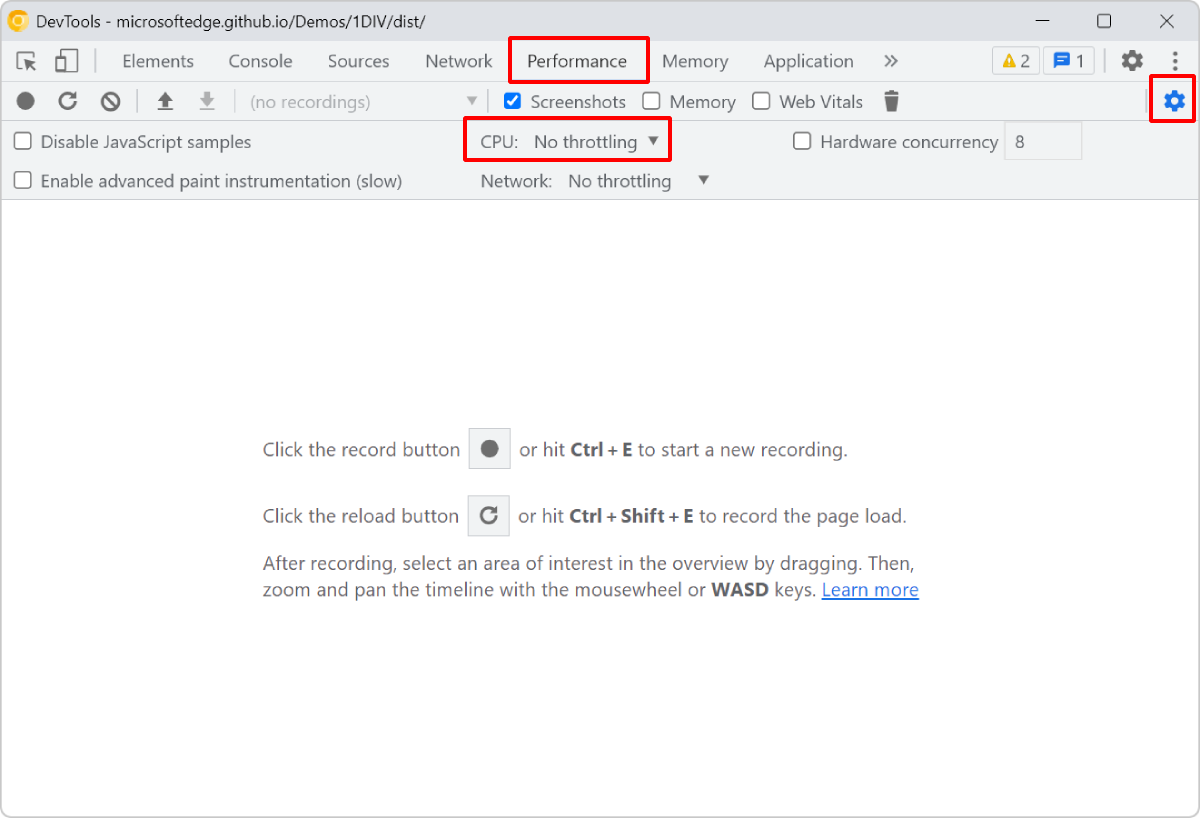
Open DevTools and go to the Performance tool.
-
In the toolbar, enable the Memory option.
-
Click Record to start the recording.
-
Interact with the page like a user would, to simulate the user scenario you want to analyze.
-
Click Stop to end the recording.
Once the resulting profile appears in the tool, a memory graph is displayed below the main flame chart area.
The memory graph shows the memory usage of the page over the time of the recording. For example, you can see how the JS heap memory (i.e, the memory region where all the JavaScript objects live) usage evolves when new objects get created (the blue line goes up) and then get garbage collected (sudden drops on the blue line).