edge
edge
 chrome
When it comes to improving web rendering performance, we often spend time working on JavaScript code. But CSS has an important role to play too in how fast a web page renders. CSS selectors, in particular, can sometimes be slow for the browser engine to match to the DOM of the page, and this can become a big problem when the web page has a large DOM tree, a lot of CSS rules, and where the DOM changes often.
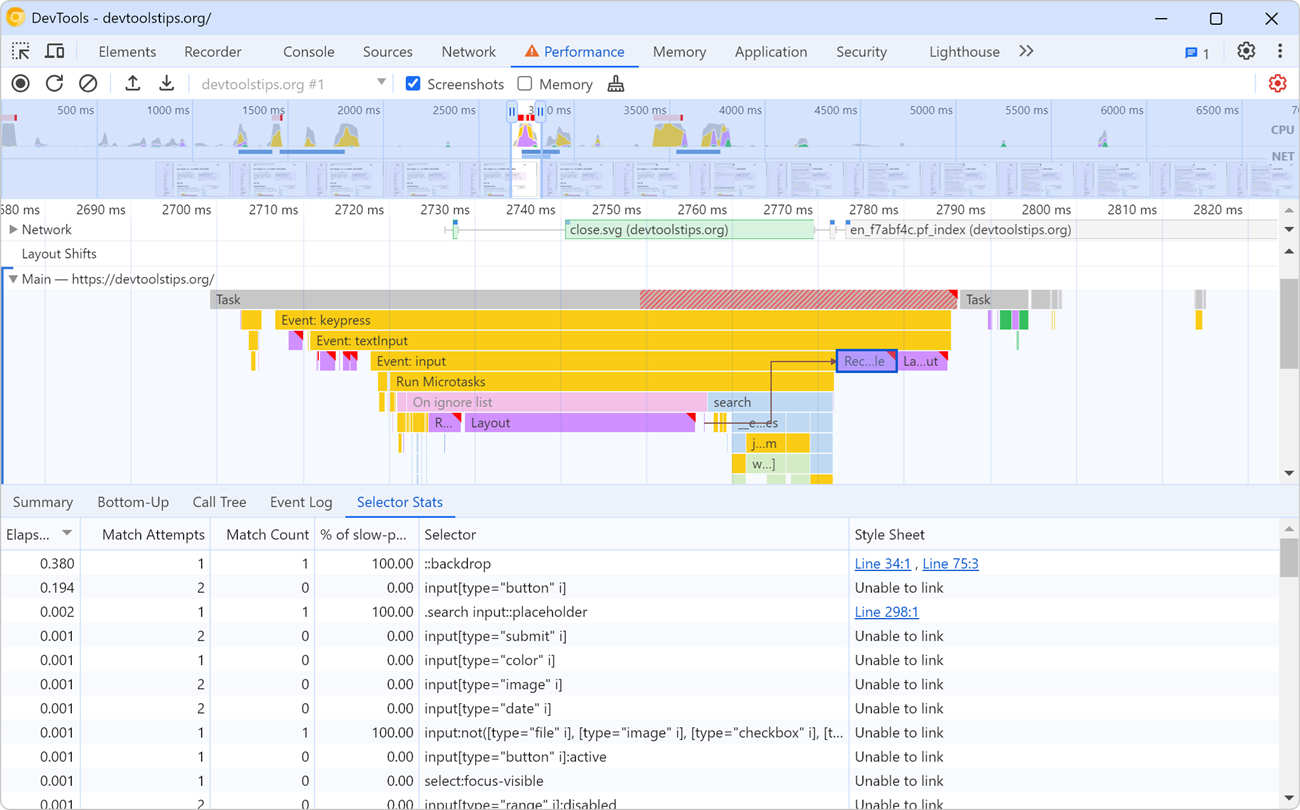
Chrome and Edge have a useful feature in the Performance tool to investigate inefficient CSS selectors, called Selector Stats.
So, before blindly rewriting your CSS selectors by following random guidelines you might have found on the web, measure the performance of slow scenarios on your web page, make sure that CSS is indeed having a negative impact, use Selector Stats to get ideas for what to improve, improve your code, and then measure again.
To use Selector Stats in Chrome or Edge:
- Open the Performance tool.
- Click Capture settings in the tool's top toolbar, and then select the Enable CSS selector stats checkbox.
- Start a new performance recording, run through your slow scenario, and then stop the recording.
- In the captured profile, identify a long-running Recalculate Style event and select it.
- In the bottom section of the Performance tool, open the Selector Stats tab.
The Selector Stats tab displays the list of CSS selectors that the browser engine had to (at least attempt to) match during this Recalculate Style event.
Sort the table by Elapsed time to find the selectors that took the most time for the engine to match. Make sure to review the Match Attempts and Match Counts columns too. For example, if the browser engine attempted to match, say, 1000 elements, but ended up really matching 0 elements, then this selector is likely too broad and could be optimized. Finally, make sure to review the % of slow-path non-matches column. This column tells you the ratio of elements that ended up not matching the selector, and for which the browser engine had to use a less optimized code path to match.
To view the Selector Stats for the entire profile instead of just a single Recalculate Style event, deselect any Recalculate Style event that you have selected by clicking in an empty area of the profile.