15 Network tips
-
Override network responses with local files
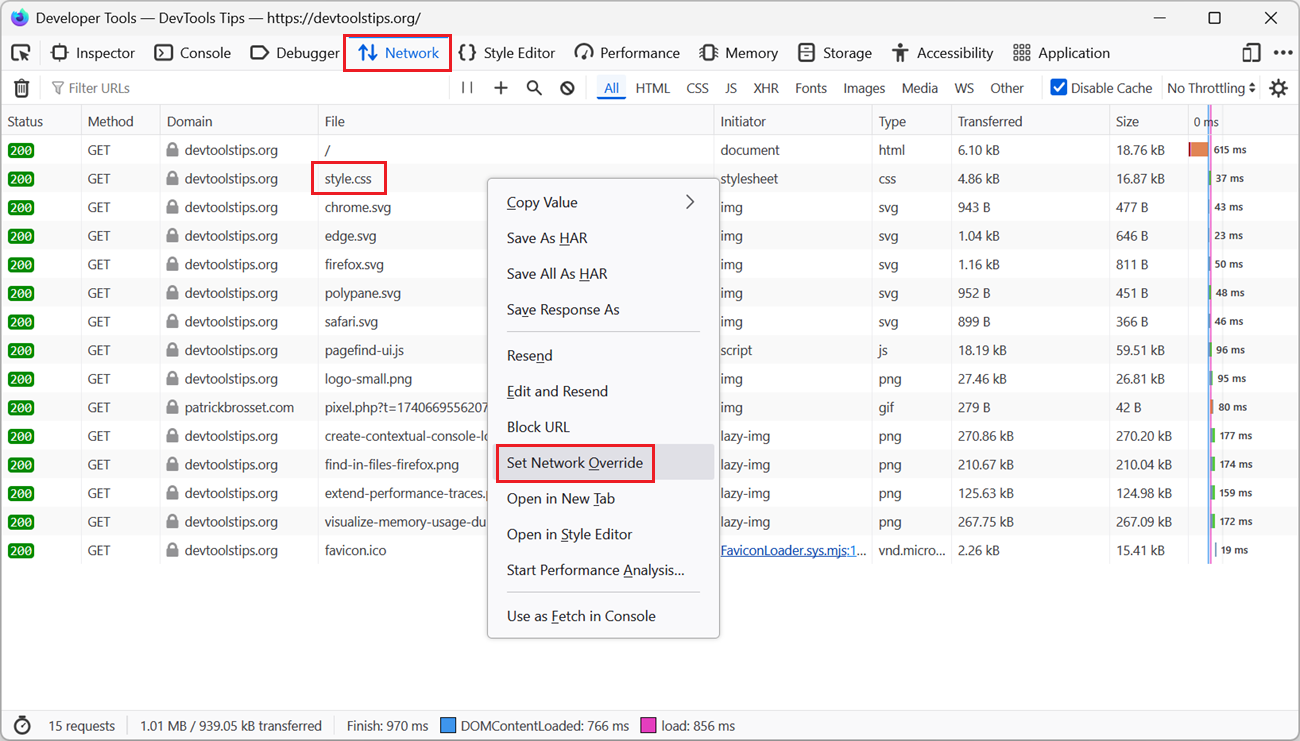 To test a quick fix locally, in DevTools, without editing the source file and deploying it to a server, override network responses with local files. Firefox # Open the Network tool. Find the reque... Read more
 -
Override HTTP response headers
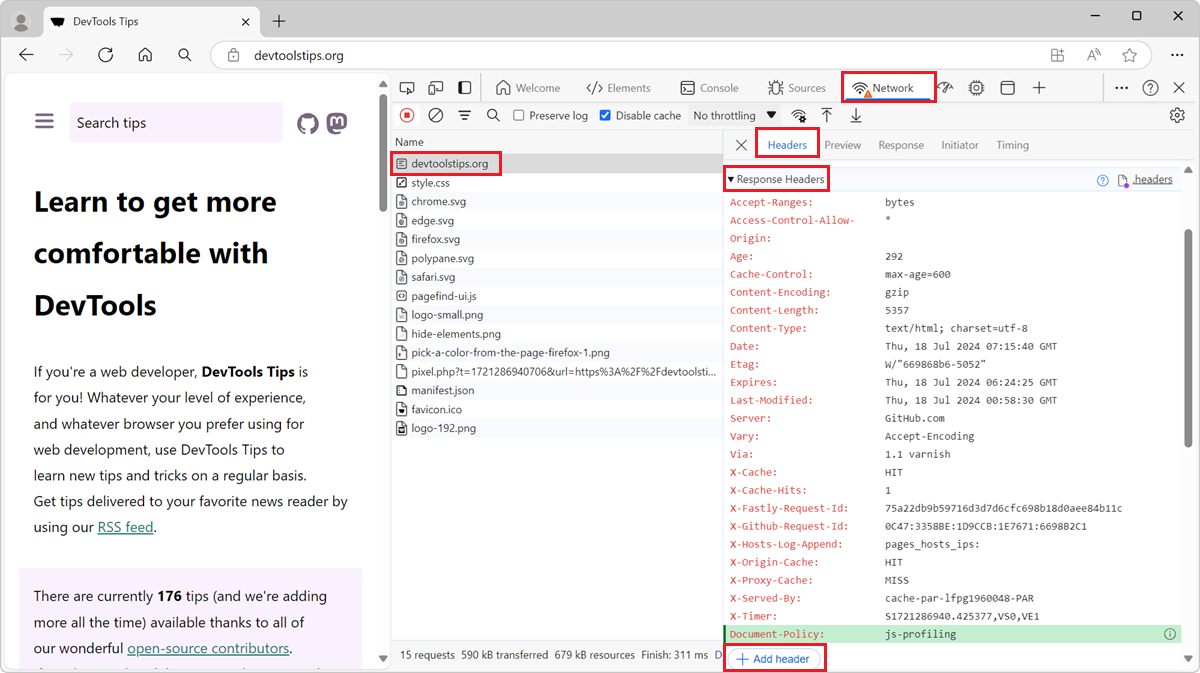 With DevTools, you can override the response headers of a network request and test your website under different conditions. HTTP response headers are metadata sent by the server to the browser, along... Read more
 -
Check if a website uses third-party cookies
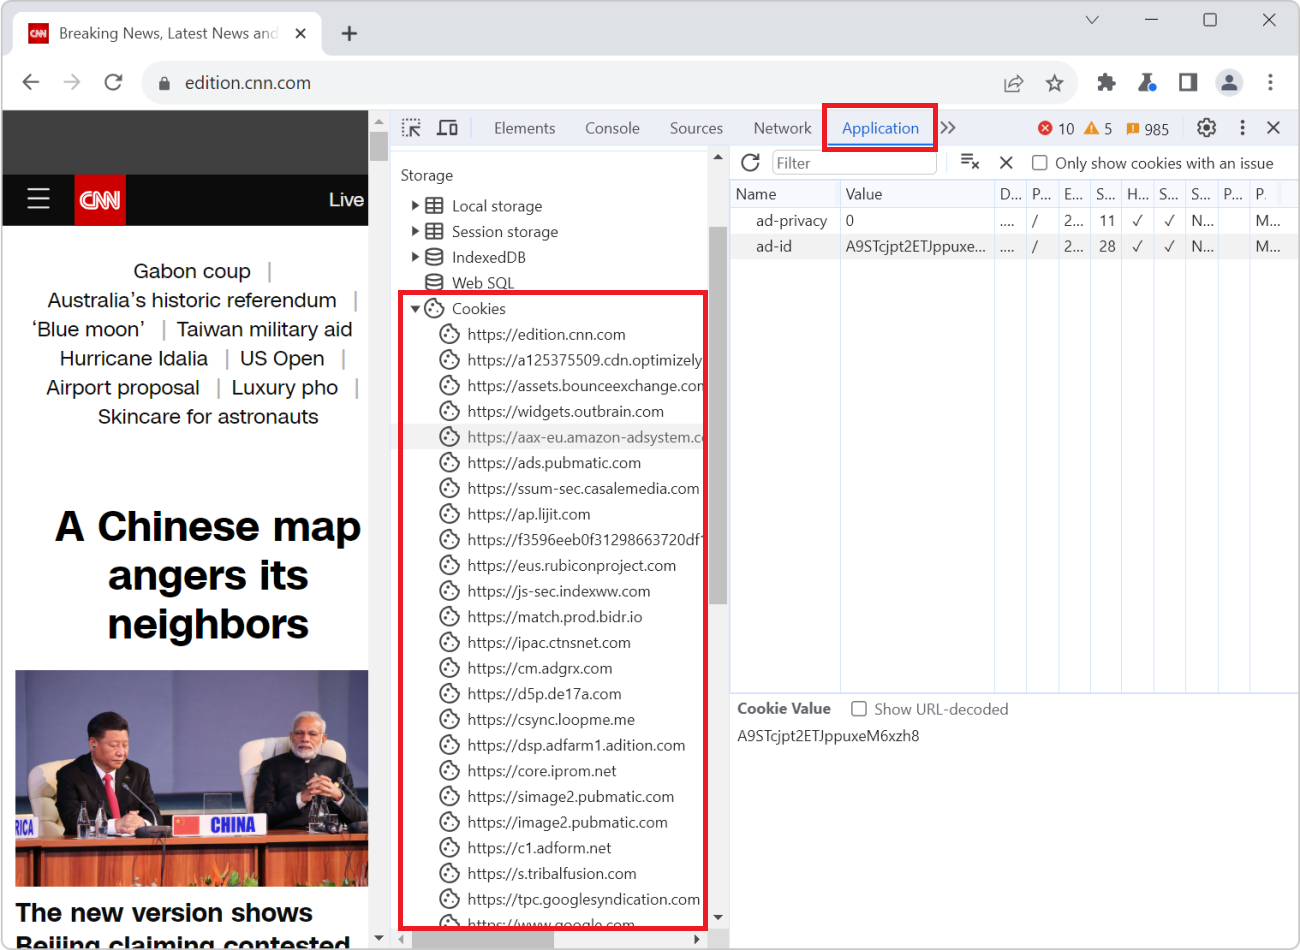 Cookies are small files that websites save on your computer when you visit them. Websites often use cookies to remember things about your last visit. For example, a weather website can use cookies to... Read more
 -
Add custom headers to the network table
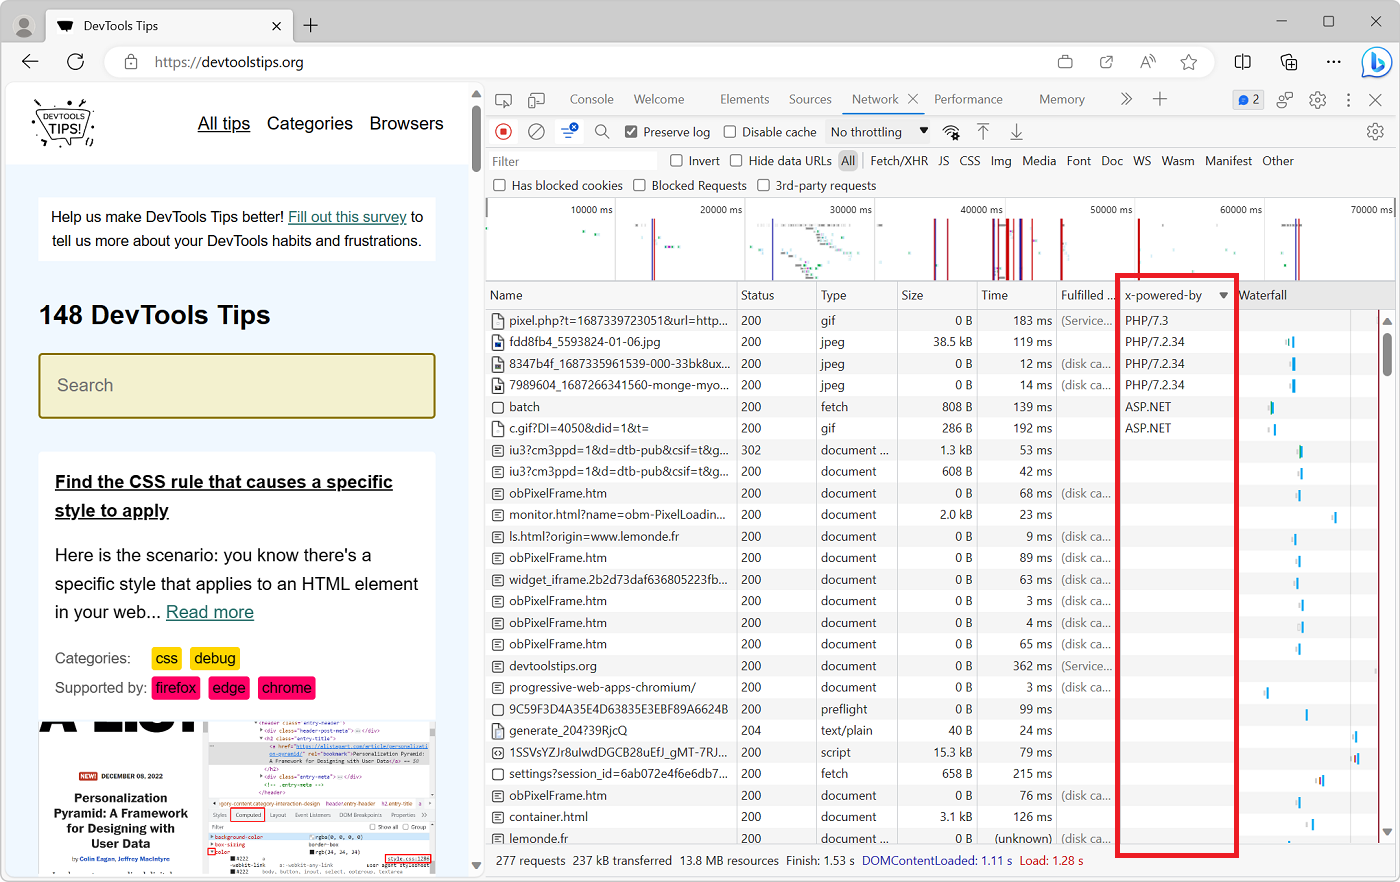 On the web, when a client (a browser) and a server communicate using HTTP, the requests and responses they send to each other contain headers. These headers are key/value pairs that contain metadata a... Read more
 -
Replay a XHR request
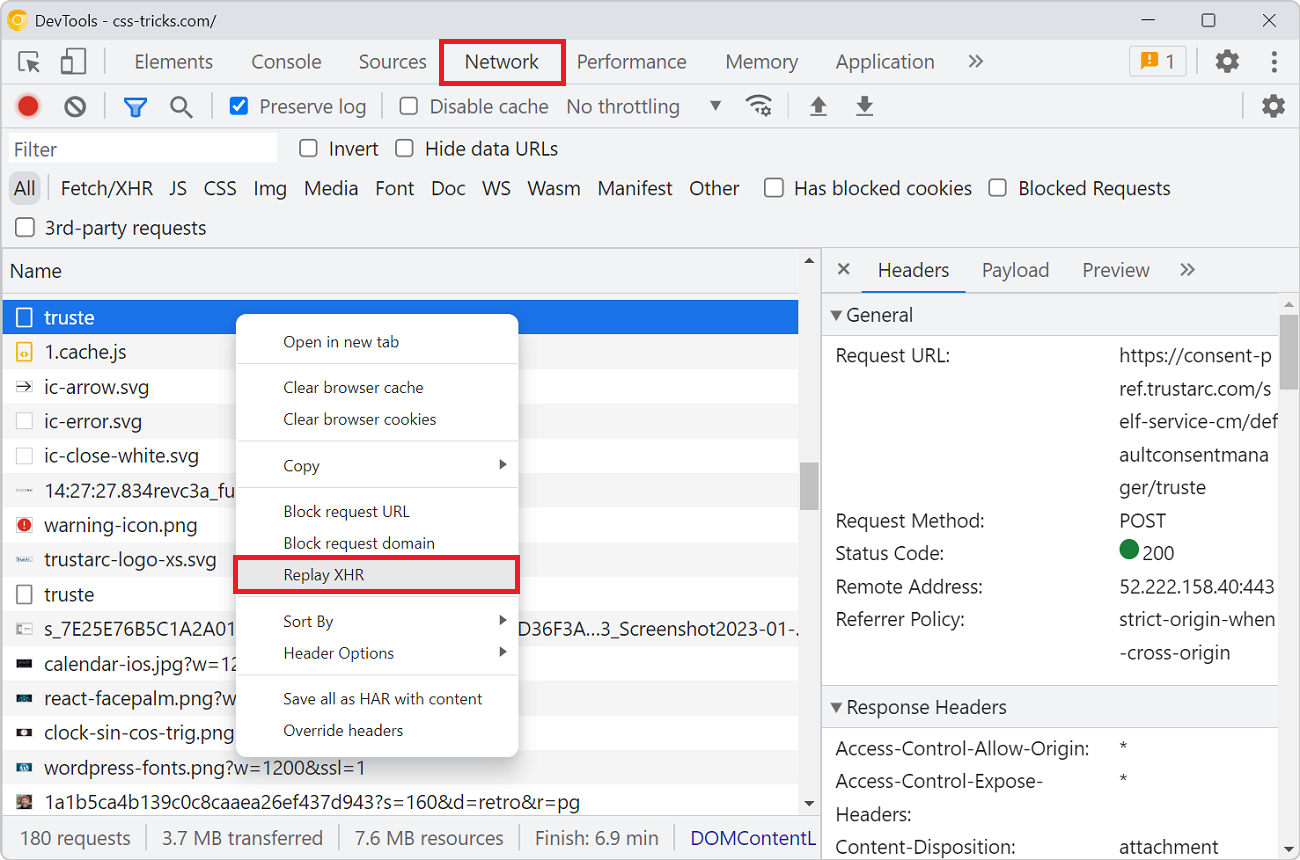 When you're debugging an XHR request to a backend service that doesn't respond with the right things it can be useful to send the request over and over again. Reloading the entire page to do so is ted... Read more
 -
See network request paths instead of names in the Network tool
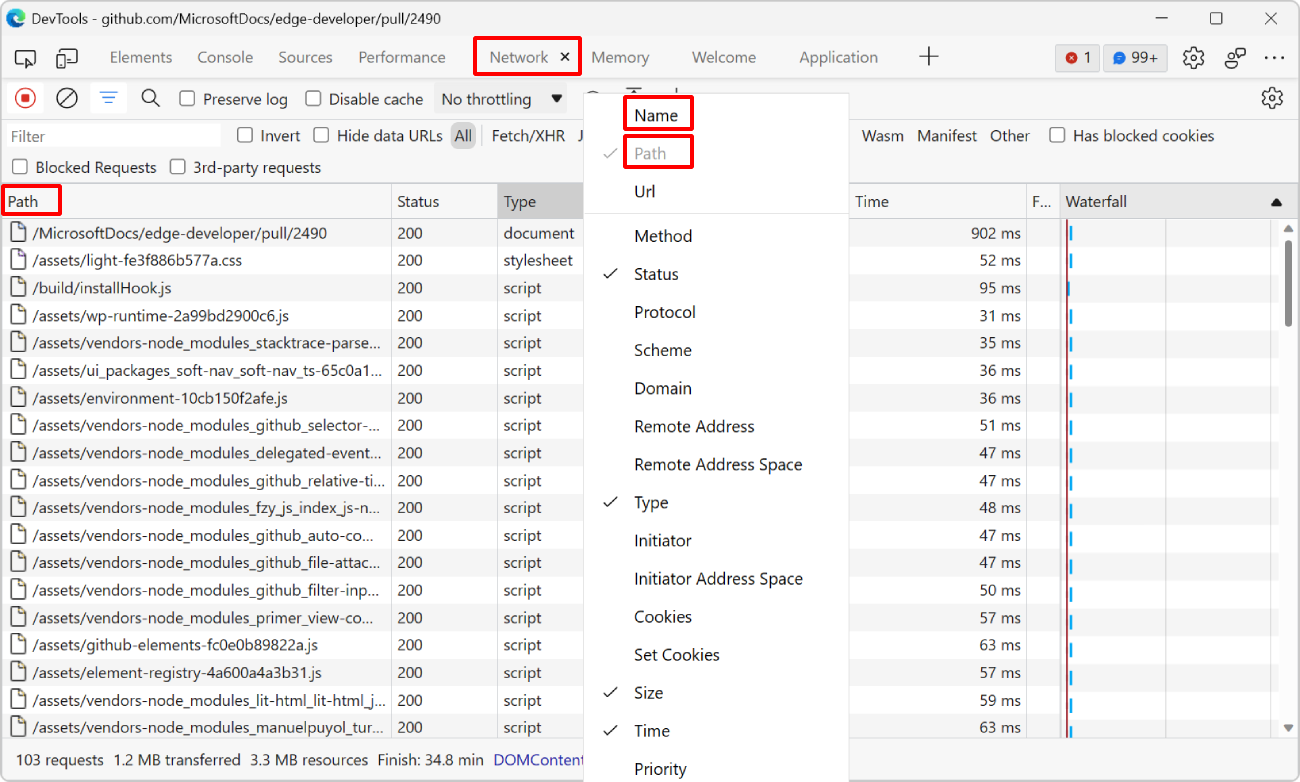 By default, the Network tool displays the name of each requested resource. For example, if a webpage requests an image from https://mysite.com/assets/img/image.png then the tool only displays image.pn... Read more
 -
See the size of the transferred data for images, scripts, or other resources
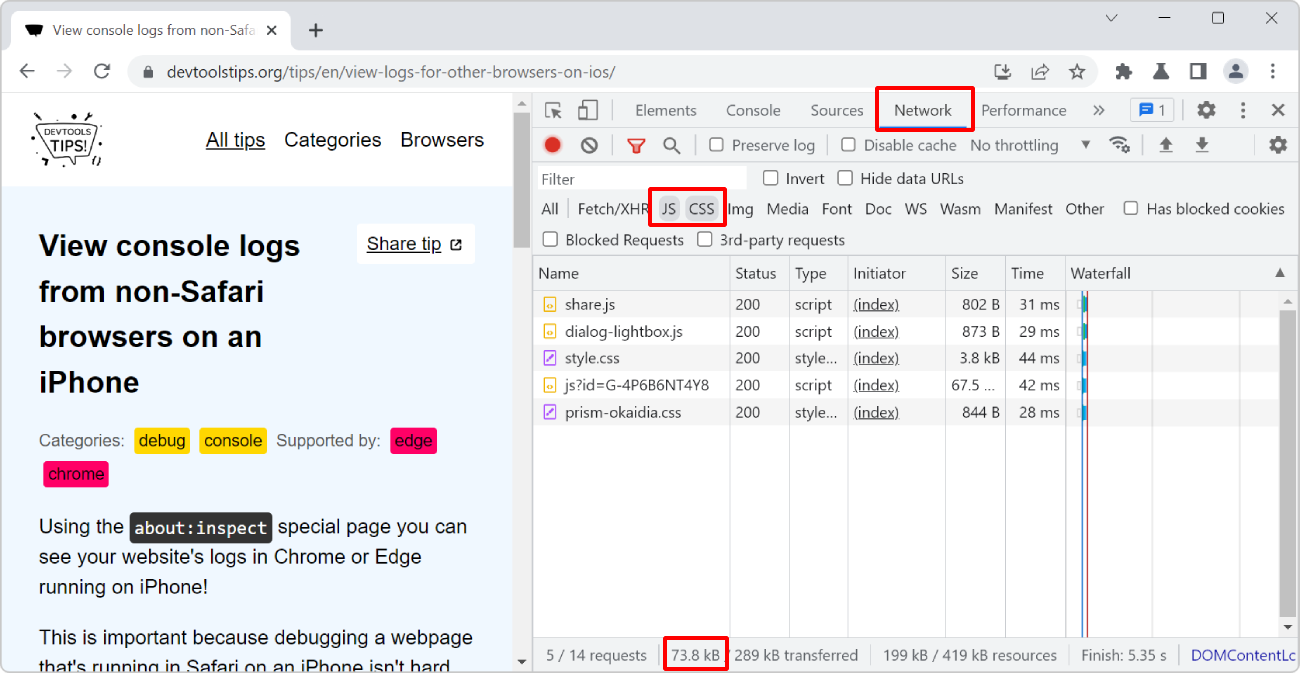 To know how much data your website transfers between the server and the client to display images, or scripts, or anything else: Open the Network tool. Refresh the page to make sure the list of req... Read more
 -
See formatted JSON responses
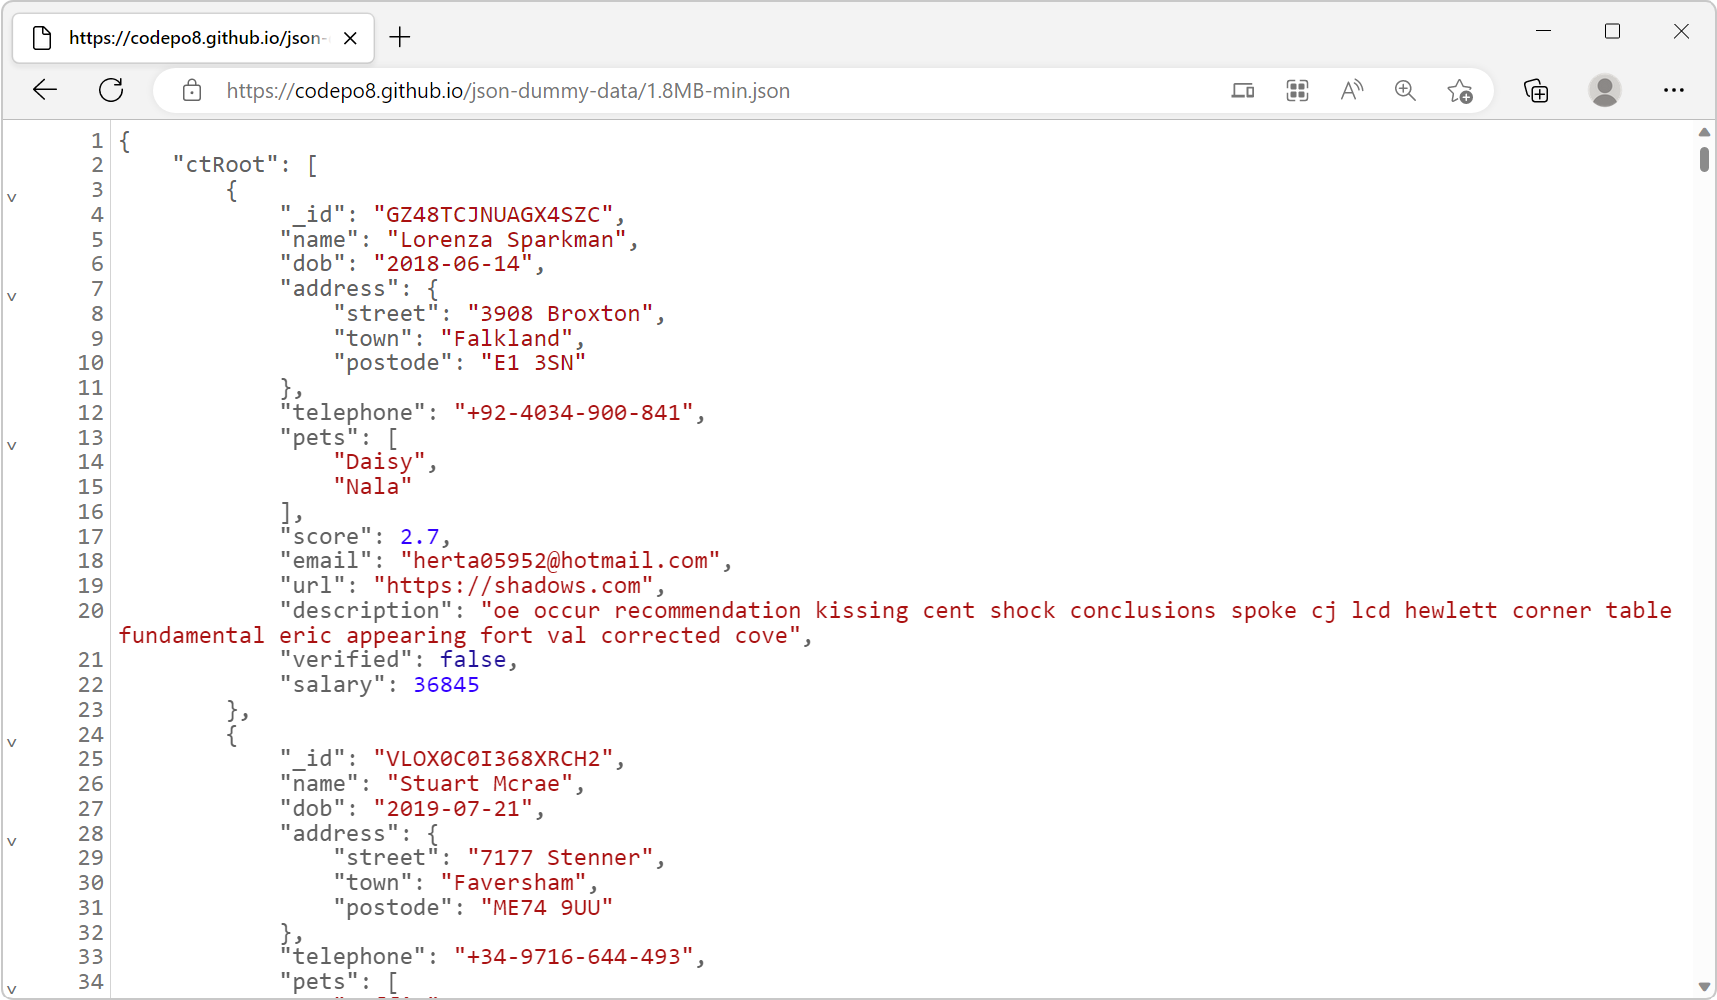 Edge (starting with 110), Firefox and Polypane all have a very nice JSON viewer tool that makes it easy to view JSON responses from your server directly in the browser window. You don't even need to o... Read more
 -
Empty the cache and hard refresh
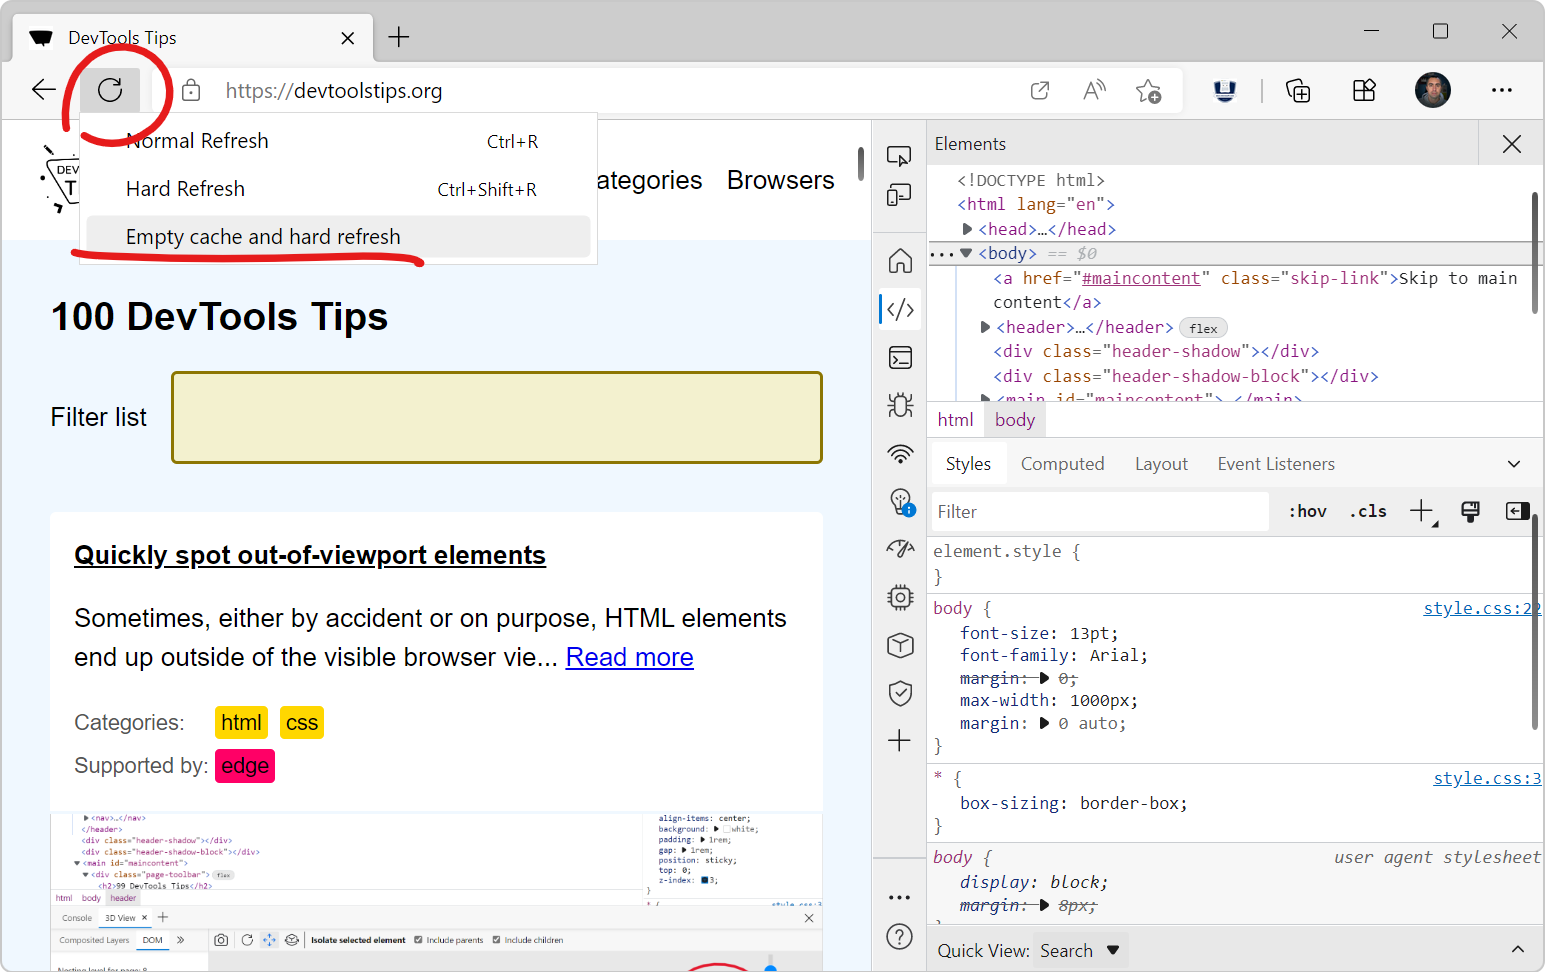 Here is a nice tip to quickly empty your cache and refresh the page, in order to test new code changes: In Chrome, or Edge, open DevTools (F12). This step is not needed for Polypane. Right-click on t... Read more
 -
Edit and resend faulty network requests to debug them
 When you're investigating a bug where the backend you connect to doesn't respond with the right things it's useful to tweak the requests and try again quickly. You can do this by changing your fronten... Read more
 -
Hide resources loaded by extensions in the Network panel
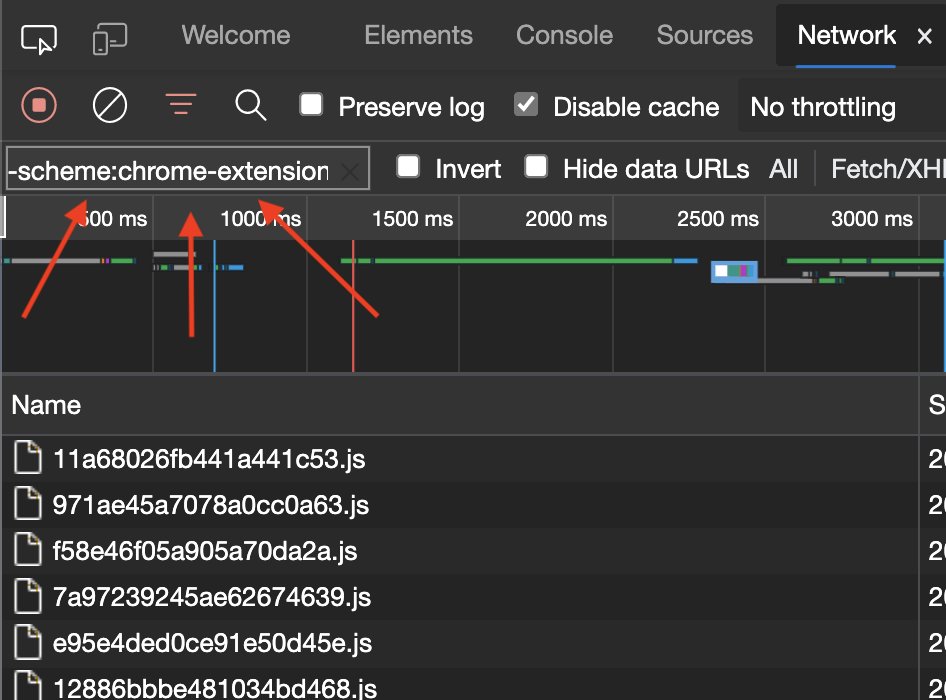 If you want to hide scripts and other resources loaded by browser extensions in the Network panel, use the -scheme:chrome-extension pattern in the filter input box. Credits go to Sunil for his post on... Read more
 -
Force PWA periodic background syncs
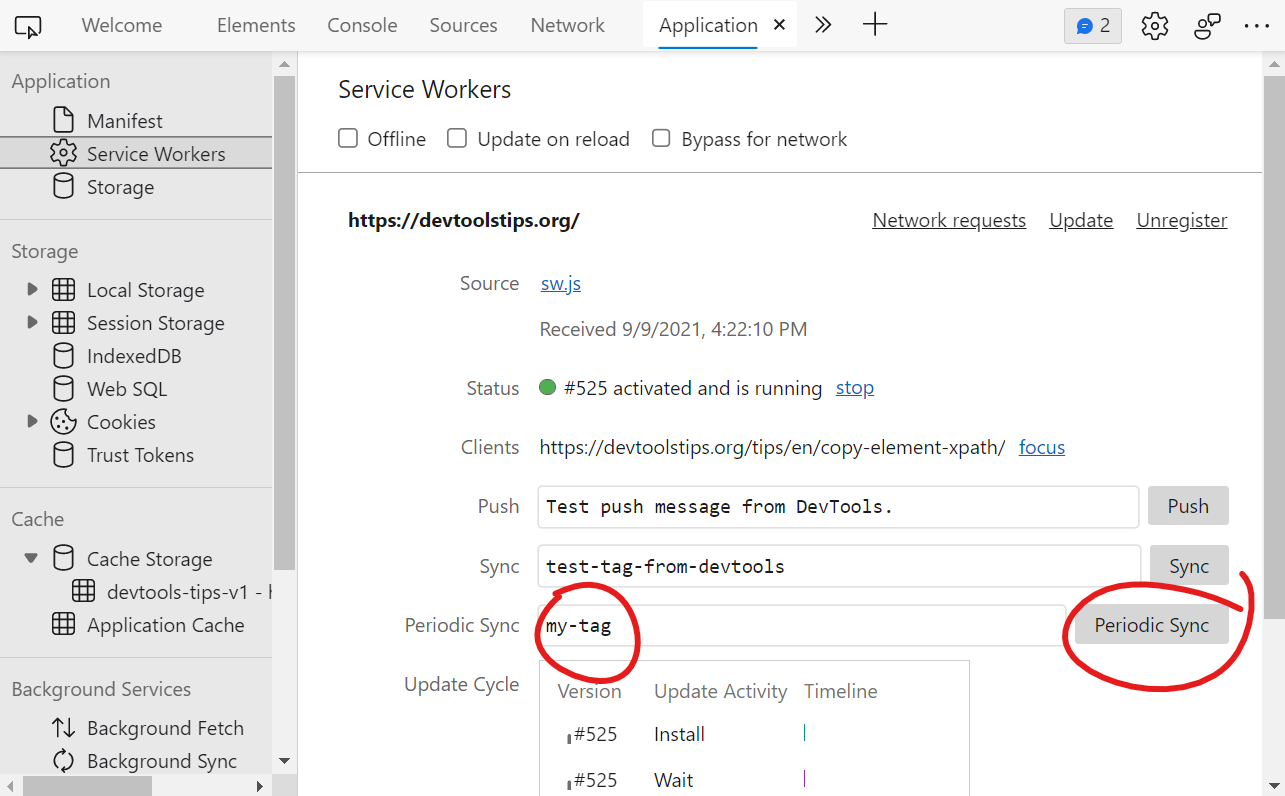 The periodic background sync API, available to PWAs is a great way to fetch new content while the user isn't on the site, and while they have access to the network, to make sure they have the latest c... Read more
 -
Block resources to test your site without CSS or JavaScript
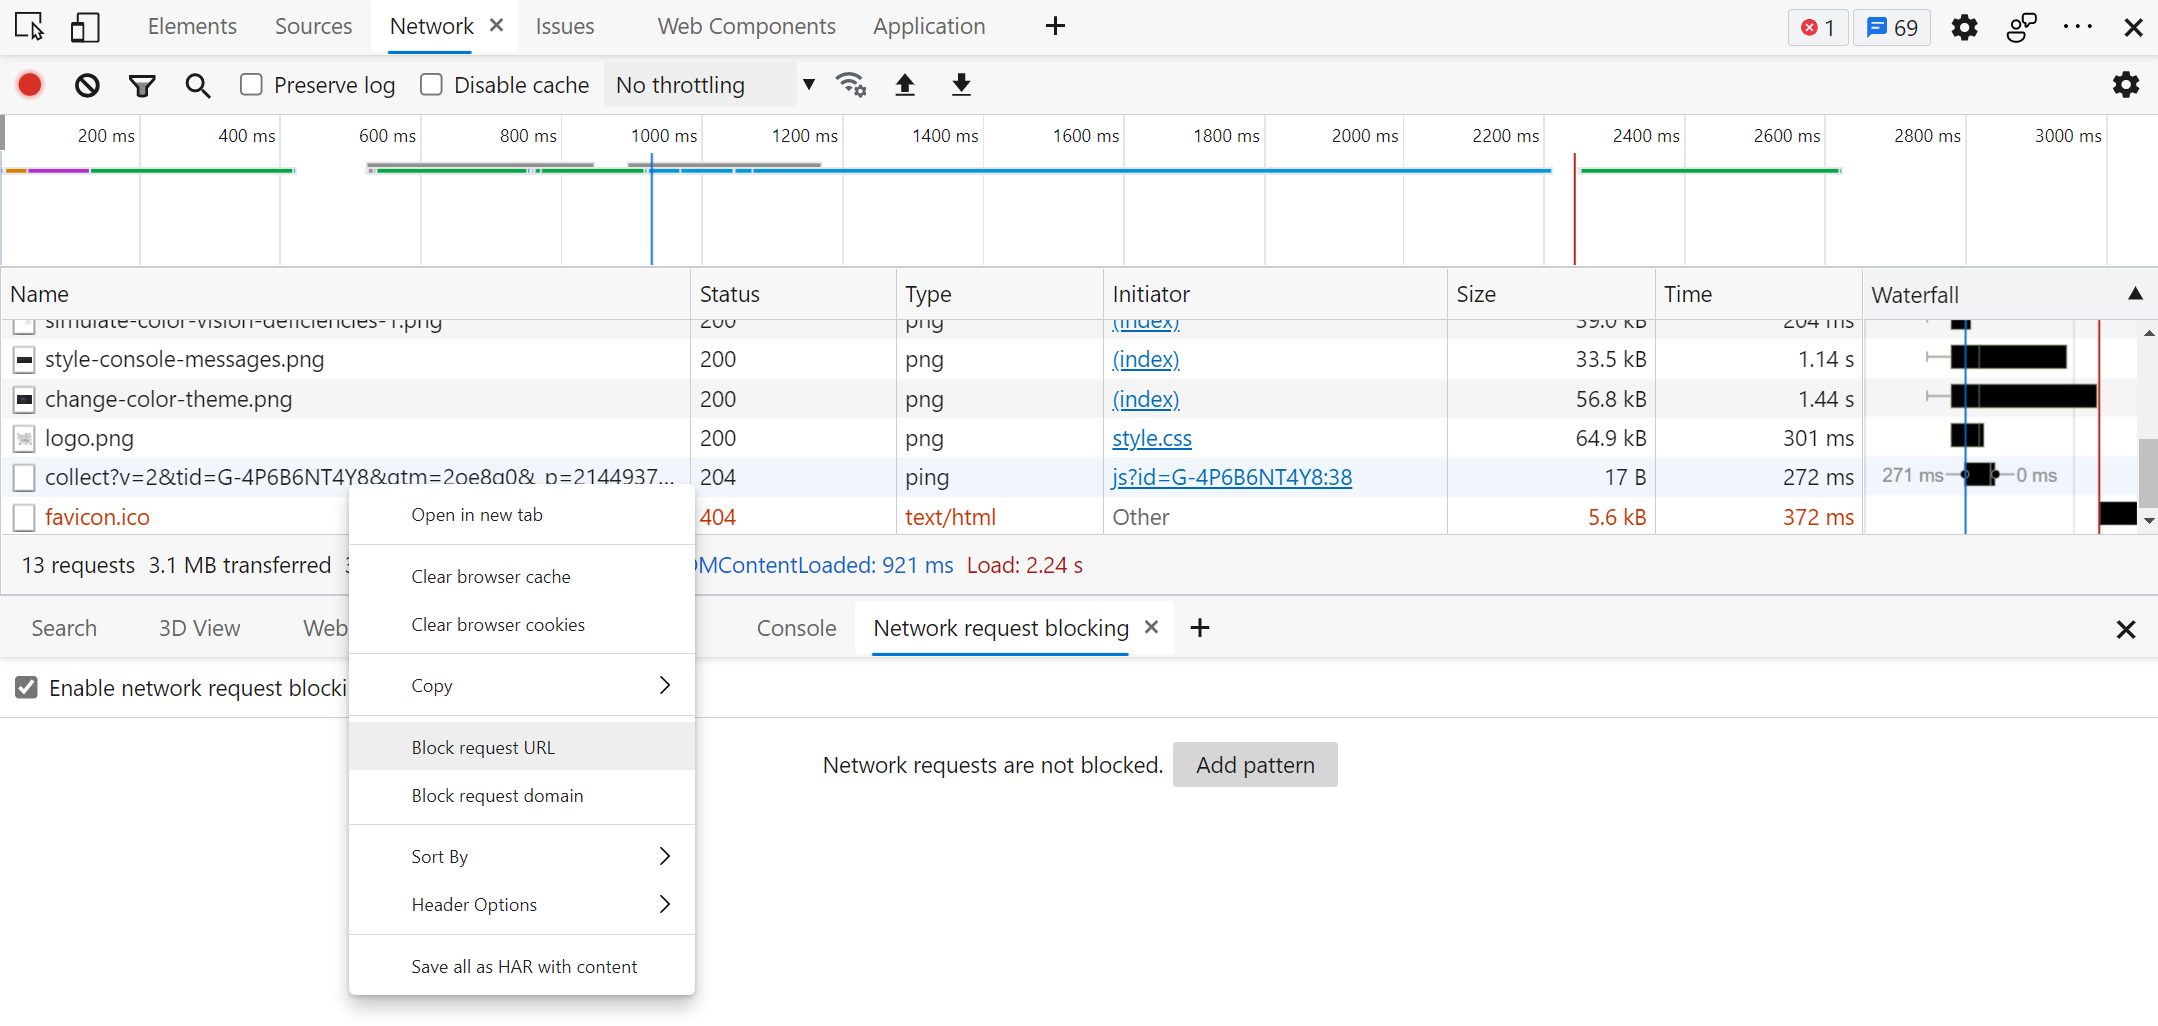 The various resources loaded by your site aren't always guaranteed to reach your users when they visit your site. Network problems can occur, JavaScript may be disabled, a CDN may be down, or the brow... Read more
 -
Throttle the network speed to test your website on slower connections
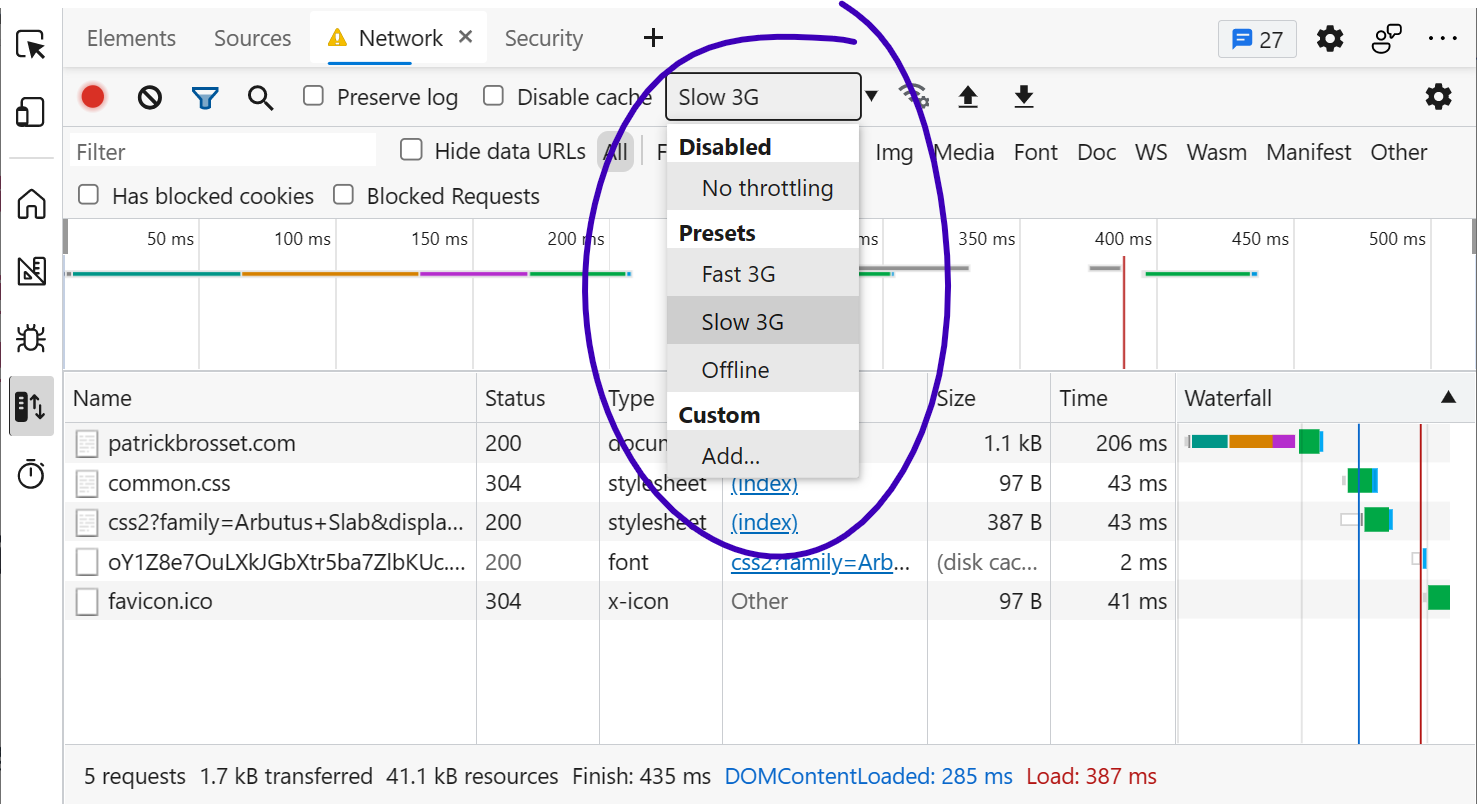 While you may develop your website on a fast network connection at home or at work, your users may not be able to use it with an equally fast connection. Perhaps they're in a moving car, or on the sub... Read more
 -
Filter requests in the Network panel by status code, mime type and more
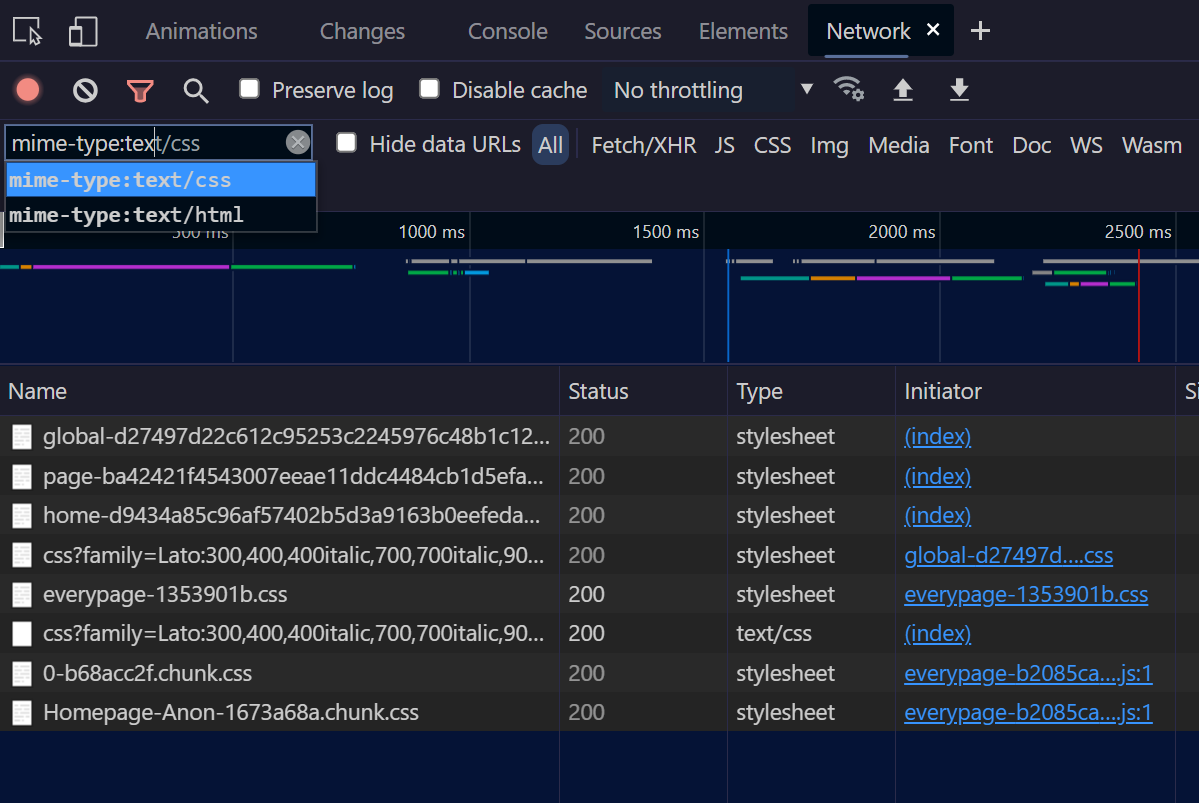 The Network panel lets you filter requests by status code, or mime type, and more. Click in the filter input field in the toolbar. Start typing status-code, you should see an autocomplete popup letti... Read more