edge
edge
 chrome
 firefox
 safari
 polypane
DevTools is confusing! There's so much functionality packed in such a small UI. Did you know that Chrome DevTools had more than 30 individual tools! Yes, that's right, 30.
It's hard for both new users and more experienced users. New users may feel overwhelmed, and more experienced users will tend to stay in the same few tools and not know that others exist.
So here is a list of all the panels available in DevTools, per browser! Want to test your knowledge? Play What's That Tool?
-
Firefox (📕Docs)
- Accessibility: Navigate the internal accessibility tree that assistive technology uses to present web pages to users.
- Application: Debug Service Workers and Web App Manifests.
- Console: View log messages, errors, and execute JavaScript expressions.
- Debugger: Debug JavaScript code.
- DOM: Navigate the list of DOM properties on the page.
- Inspector: View the DOM tree, authored and computed styles, edit CSS, and get layout information.
- Memory: Capture and navigate memory snapshots of the current page.
- Network: View network traffic on the page and inspect individual HTTP requests and responses.
- Performance: Measure the runtime performance of the page and understand bottlenecks.
- Storage: View and edit cookies, local storage, cache, etc.
- Style editor: Edit stylesheets on the page and create new ones.
-
Chrome (📕Docs)
- Animations: View and edit CSS animations, transitions, and Web Animations API animations.
- Application: Debug your PWA Service Workers, Web Apps Manifest. View and edit IndexedDB, local storage, cache. Debug background services such as notifications and background sync.
- Changes: See all the CSS changes you made on the page in DevTools.
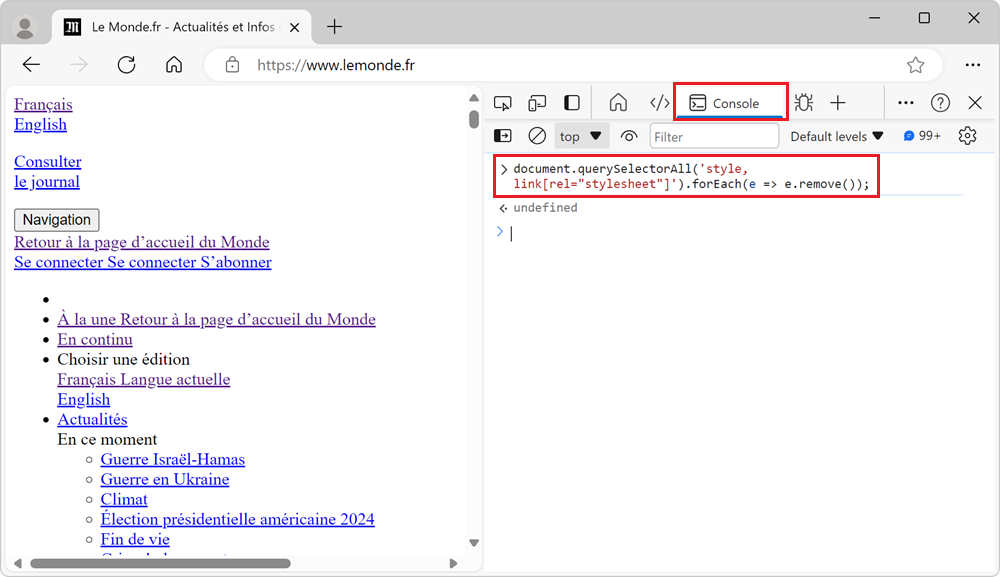
- Console: View log messages, errors, and execute JavaScript expressions.
- Coverage: Generate code coverage reports for JavaScript and CSS to detect how much code is used.
- CSS overview: Get a summary of the CSS styles on the page, including colors, contrast ratio, and fonts.
- Developer resources: missing, please help by editing this file
- Elements: View the DOM tree, authored and computed styles, edit CSS, and get layout information.
- Issues: Detect common issues with your webpage.
- Javascript profiler: Record JavaScript code execution on the page for some time and then view time spent in each function.
- Layers: See the various compositing layers the browser engine created based on your page's DOM and CSS code.
- Lighthouse: Run Lighthouse audits on your page.
- Media: missing, please help by editing this file
- Memory: Capture memory snapshot of the current page and understand what retains objects in memory.
- Memory inspector: Inspector JavaScript ArrayBuffers.
- Network: View network traffic on the page and inspect individual HTTP requests and responses.
- Network conditions: Modify certain network conditions such as cache, speed, and user-agent.
- Network request blocking: Define custom patterns for URLs you want to block.
- Performance: Analyze your page's runtime performance, including CPU usage, GPU activity, memory usage, refresh rate, user interactions, layout and graphic engine operations, and more.
- Performance insights: Get actionable performance insights about your page.
- Performance monitor: Monitor your page's performance live with CPU usage, memory size, DOM node numbers, etc.
- Protocol monitor: Monitor the CDP (Chrome DevTools Protocol) traffic that DevTools relies on to debug your page.
- Quick source: A simpler version of the Sources panel.
- Recorder: Record user scenarios in the tab, and easily replay them automatically.
- Rendering: Emulate different rendering modes: media features, color vision deficiencies, and more.
- Search: Search within the resources loaded on the page.
- Security: Get an overview of the page's security aspects.
- Sensors: Simulate device location, orientation and touch events.
- Sources: View the currently loaded resources on the page, edit stylesheets, and debug JavaScript code.
- Web audio: View the audio node graph.
- Webauthn: Create virtual authentication environments to debug your web authentication flows.
- What's new: Get highlights from the most recent DevTools update.
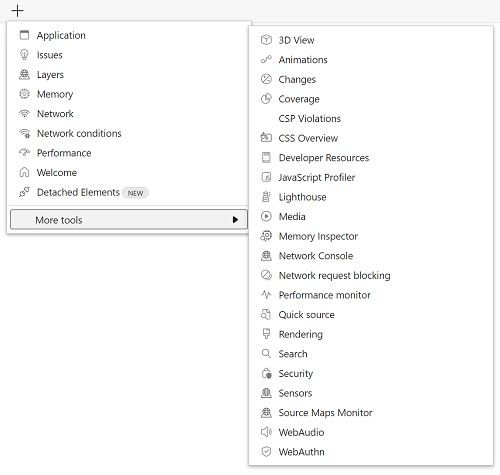
-
Edge (📕Docs)
- 3D view: View your page's DOM, z-index stacking, or layers tree in 3D.
- Animations: View and edit CSS animations, transitions, and Web Animations API animations.
- Application: Debug your PWA Service Workers, Web Apps Manifest. View and edit IndexedDB, local storage, cache. Debug background services such as notifications and background sync.
- Changes: See all the CSS changes you made on the page in DevTools.
- Console: View log messages, errors, and execute JavaScript expressions.
- Coverage: Generate code coverage reports for JavaScript and CSS to detect how much code is used.
- Css overview: Get a summary of the CSS styles on the page, including colors, contrast ratio, and fonts.
- Detached elements: Find DOM elements in memory that are no longer attached to the DOM, and record heap snapshots to find what retains them.
- Developer resources: missing, please help by editing this file
- Elements: View the DOM tree, authored and computed styles, edit CSS, and get layout information.
- Issues: Detect common issues with your webpage. The issues are powered by webhint.
- Javascript profiler: Record JavaScript code execution on the page for some time and then view time spent in each function.
- Layers: See the various compositing layers the browser engine created based on your page's DOM and CSS code.
- Lighthouse: Run Lighthouse audits on your page.
- Media: missing, please help by editing this file
- Memory: Capture memory snapshot of the current page and understand what retains objects in memory.
- Memory inspector: Inspector JavaScript ArrayBuffers.
- Network: View network traffic on the page and inspect individual HTTP requests and responses.
- Network conditions: Modify certain network conditions such as cache, speed, and user-agent.
- Network console: Create and manage your API requests and test them whenever you want.
- Network request blocking: Define custom patterns for URLs you want to block.
- Performance: Analyze your page's runtime performance, including CPU usage, GPU activity, memory usage, refresh rate, user interactions, layout and graphic engine operations, and more.
- Performance monitor: Monitor your page's performance live with CPU usage, memory size, DOM node numbers, etc.
- Protocol monitor: Monitor the CDP (Chrome DevTools Protocol) traffic that DevTools relies on to debug your page.
- Quick source: A simpler version of the Sources panel.
- Recorder: Record user scenarios in the tab, and easily replay them automatically.
- Rendering: Emulate different rendering modes: media features, color vision deficiencies, and more.
- Search: Search within the resources loaded on the page.
- Security: Get an overview of the page's security aspects.
- Sensors: Simulate device location, orientation and touch events.
- Source maps monitor: Check where source maps are downloaded from.
- Sources: View the currently loaded resources on the page, edit stylesheets, and debug JavaScript code.
- Webaudio: View the audio node graph.
- Webauthn: Create virtual authentication environments to debug your web authentication flows.
- Welcome: Get help, resources, and latest news.
-
Safari (📕Docs)
- Elements: View the DOM tree, authored and computed styles, edit CSS, and get layout information.
- Console: View log messages, errors, and execute JavaScript expressions.
- Sources: View the currently loaded resources on the page, edit stylesheets, and debug JavaScript code.
- Network: View network traffic on the page and inspect individual HTTP requests and responses.
- Timelines: Record performance profiles on your page and visualize network requests, layout and rendering operations, user events and JavaScript execution, and CPU usage.
- Storage: View and edit local storage.
- Graphics: missing, please help by editing this file
- Layers: See the various compositing layers the browser engine created based on your page's DOM and CSS code.
- Audit: Run audits on the page.
-
Polypane (📕Docs)
- Meta: An overview of all meta data, robots.txt, structured data, webmanifest and social media previews
- Outline: View the heading, landmark, image, link outlines, as well as the focus order of the page.
- Storage: An overview of the localstorage, sessionstorage and cookies of the page.
- Accessibility: Run an automated accessibility scan.
- Source: Show a formatted version of the HTML source of the page along with HTML validation.
- Elements: View the DOM tree, authored and computed styles, edit CSS, get layout and accessibility information.
- Console: View log messages, errors, and execute JavaScript expressions.
- Live CSS: Inject CSS into the current page.
- Devtools: Access the regular Chromium devtools. (See above)
- Browse: Open a second URL along your main one
- Workspaces: Save and restore different sets of devices to test on.