edge
edge
Note: This Microsoft Edge-specific feature is being removed starting with Edge 133. The feature that it provides will continue to be available by using the Memory tool instead, and using the upcoming Detached Elements profiling type. The new profiling type will be available in all Chromium-browsers.
Memory leaks can quickly become a big problem for long-running applications, and a common source of memory leaks is detached DOM elements (elements that are no longer attached to the DOM tree).
It's usually very hard to investigate these memory leaks, because it's hard to know if elements are detached, and which ones, let alone find which part of your JavaScript code is causing them to be detached.
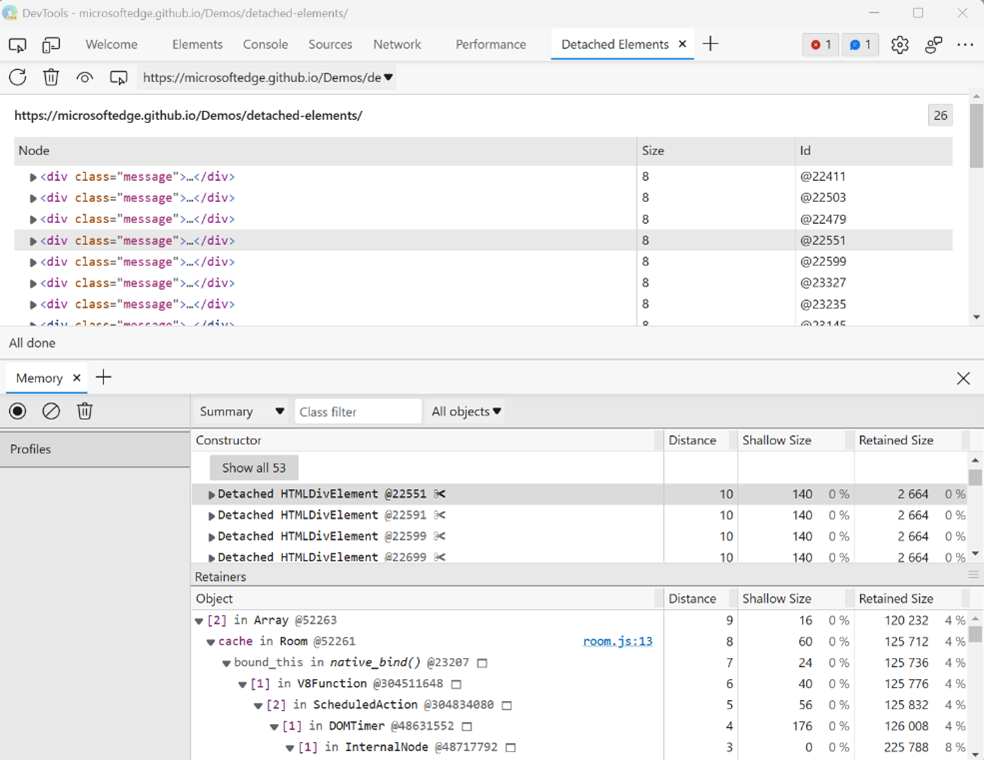
Edge has a tool just for this: the Detached Elements panel. To use it:
- Open the command menu and type "detached" to find and open the Detached Elements tool.
- Click the Get detached elements button to list all of the currently detached elements.
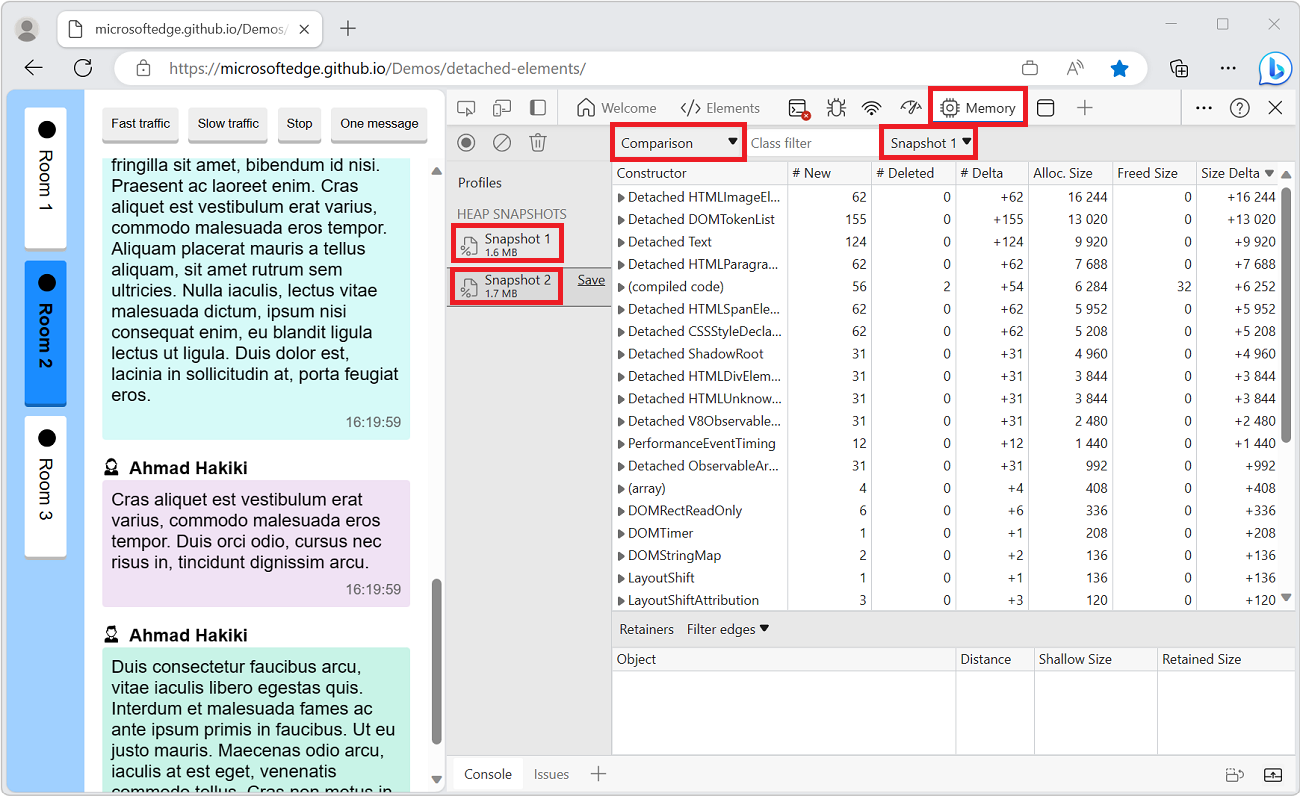
- Click the Analyze button to take a memory heap snapshot. Once done, you can then double-click any of the detached elements' Ids to find the link between these elements and your JavaScript code in the Memory panel.
- Don't forget to click the Collect garbage button every once in a while to force garbage collection. Then get the detached elements again. Indeed, some elements may remain in memory simply because the browser hasn't yet cleaned them up. Forcing GC makes sure the list only contains the elements that are detached and cannot be cleaned up.
You can find out much more about this tool in this blog post and over at Microsoft's documentation site.