edge
edge
 chrome
 firefox
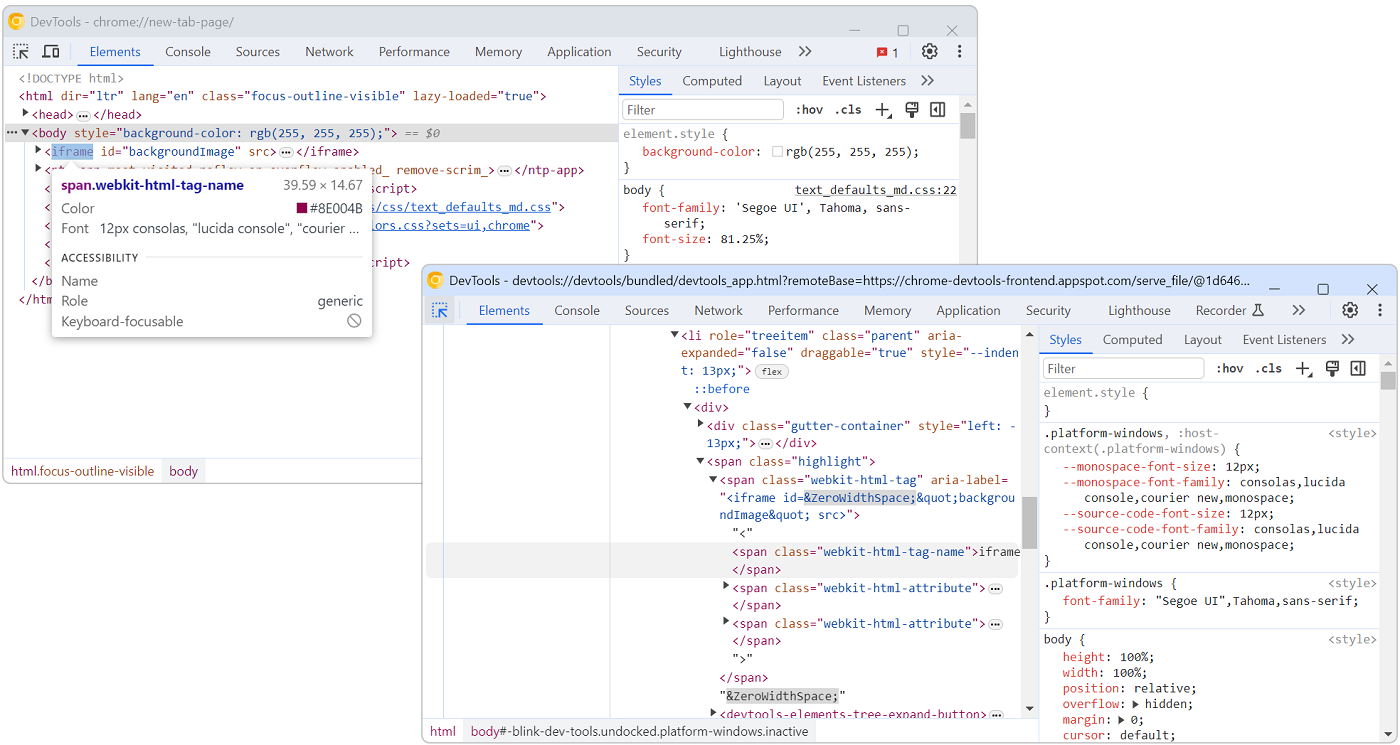
The user interface of DevTools is built with HTML, CSS, and JavaScript. This means you can inspect and debug DevTools with DevTools.
Chromium #
To debug DevTools in Chromium-based browsers, such as Chrome or Edge:
-
Open DevTools on any browser tab.
-
Undock DevTools into a separate window.
-
Press Ctrl+Shift+I (Cmd+Opt+I on macOS) to open a second DevTools window.
This second DevTools window now targets the first one. Anything you see in the Elements tool represents elements of the first DevTools window's user interface.
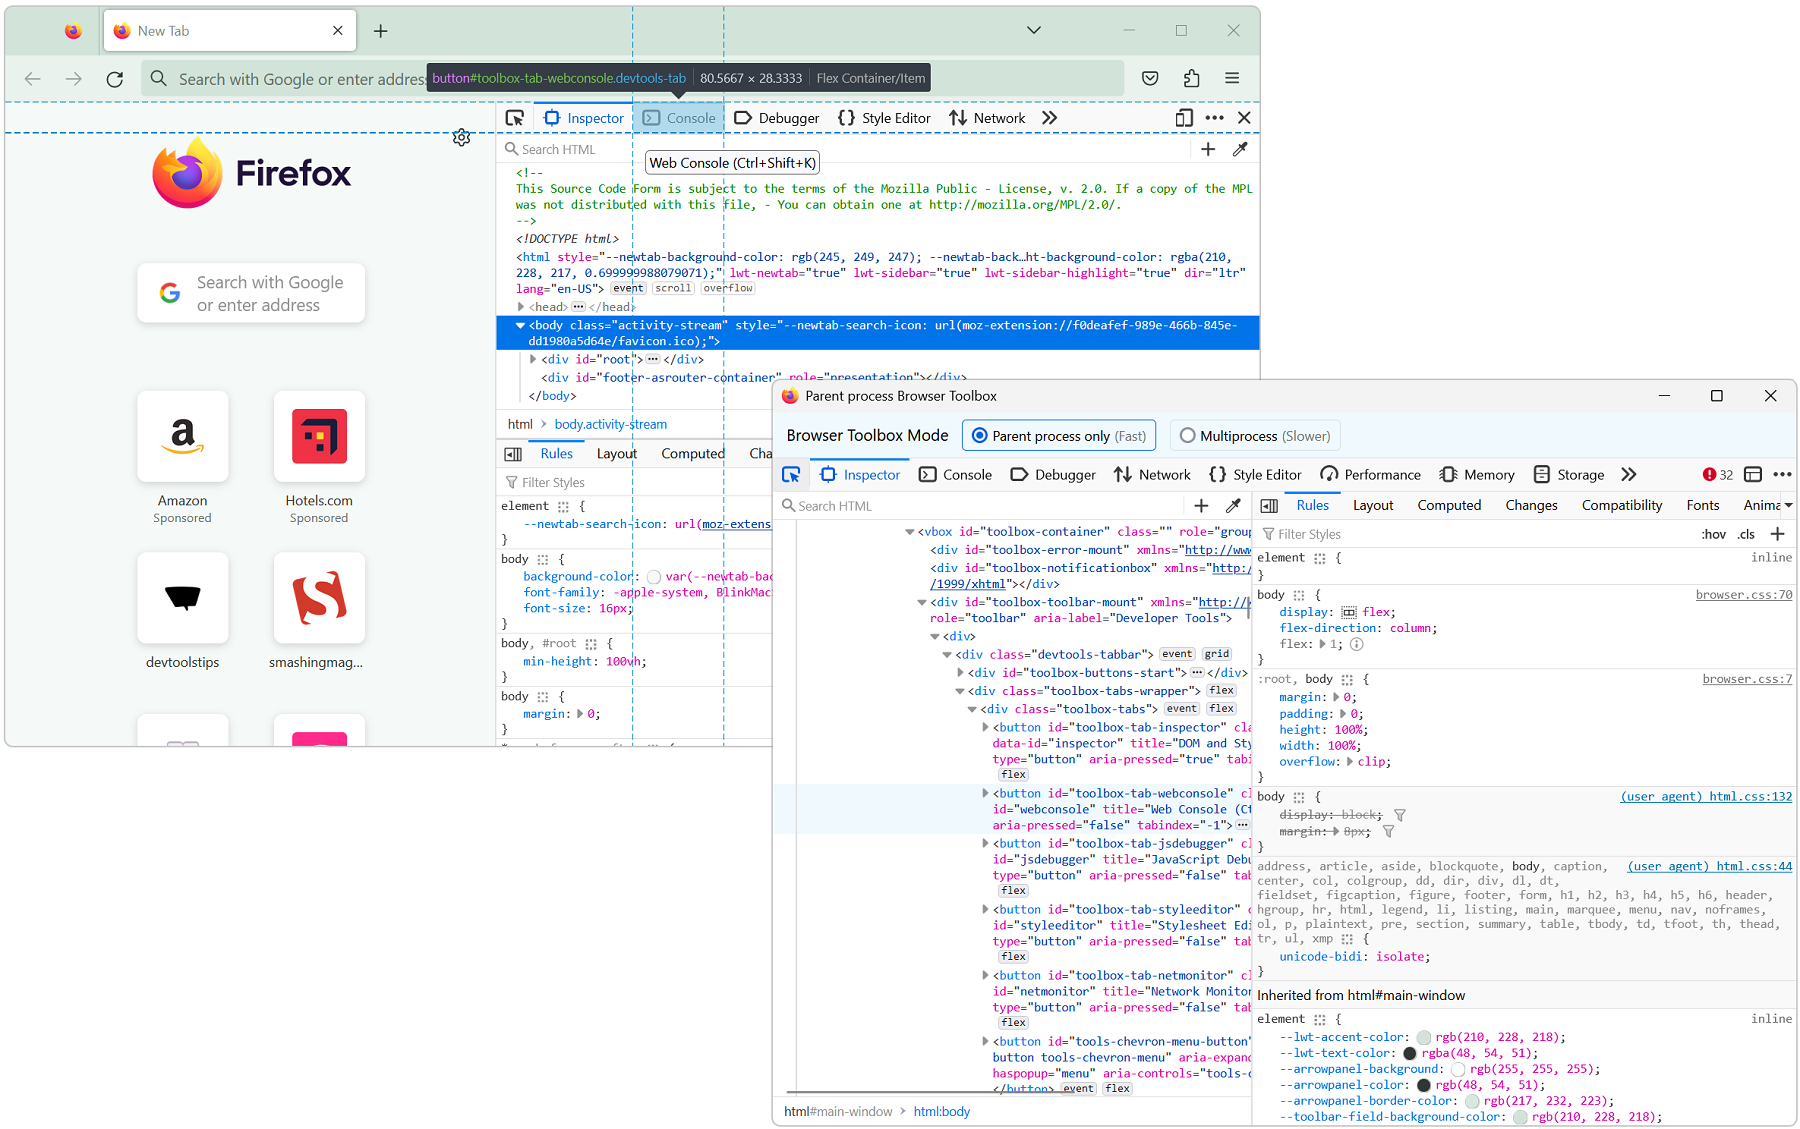
Firefox #
To debug DevTools in Firefox:
-
Open DevTools on any browser tab.
-
Open the Settings page by pressing F1.
-
Under Advanced settings, check the Enable browser chrome and add-on debugging toolboxes and Enable remote debugging checkboxes.
-
Now in the main Firefox toolbar, click Open application menu (the hamburger menu).
-
Click More tools > Browser Toolbox.
A new DevTools window appears. This one inspects the entire Firefox browser window. The elements you see in the Inspector tool represent elements of the Firefox user interface, including its DevTools.