edge
edge
 chrome
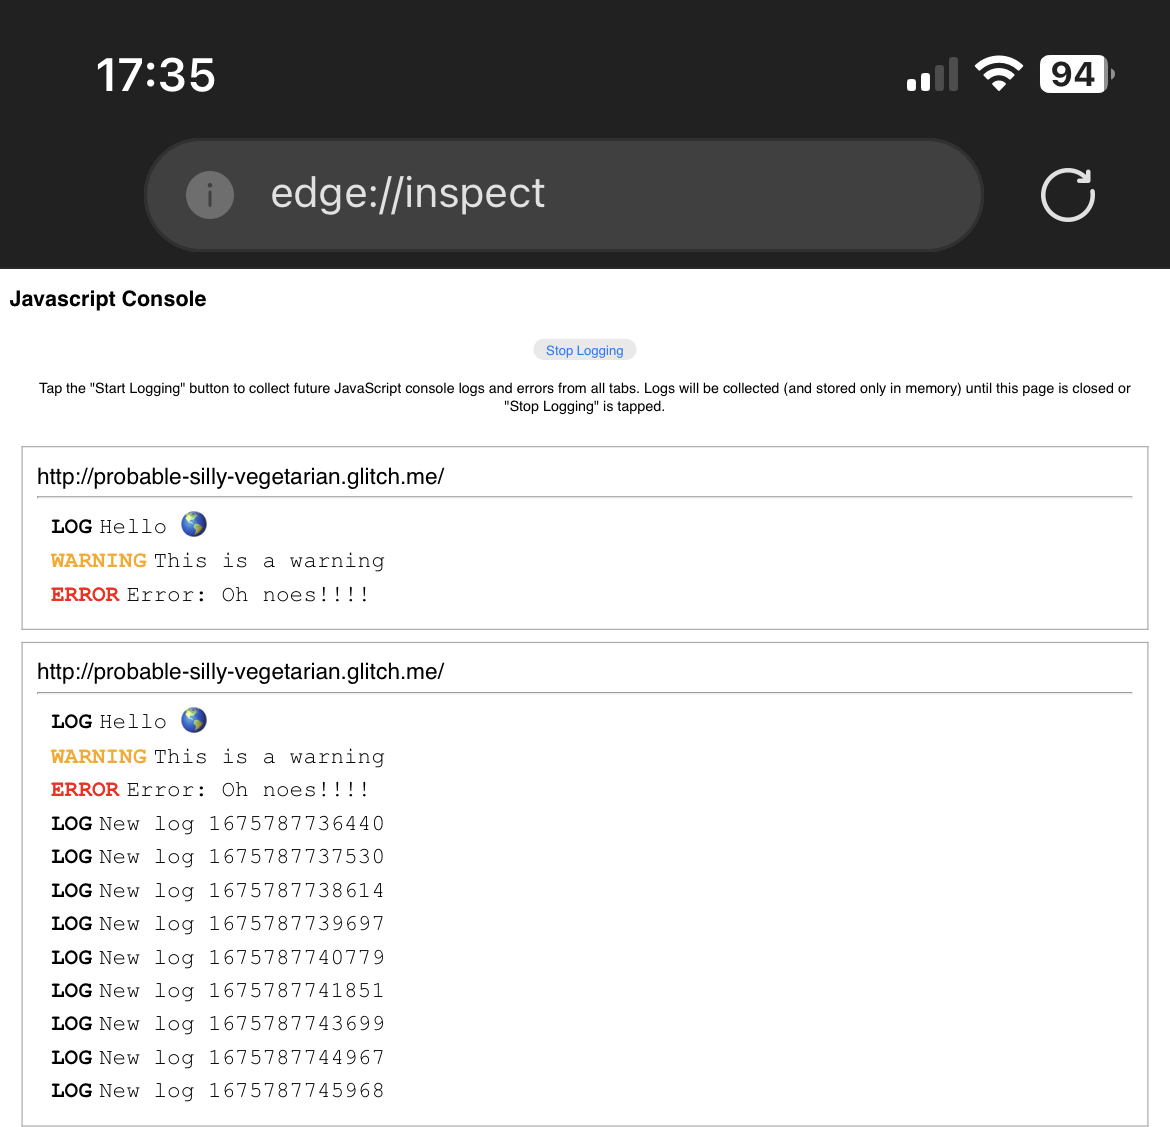
Using the about:inspect special page you can see your website's logs in Chrome or Edge running on iPhone!
This is important because debugging a webpage that's running in Safari on an iPhone isn't hard, but debugging the same webpage when it's running in Chrome or Edge on an iPhone is impossible, and sometimes there are pages that may work in Safari, but not in Chrome or Edge.
The former requires connecting your iPhone to a Mac via USB, enabling the WebInspector tools on the Mac, and connecting from Safari desktop to Safari mobile (learn more at Enabling Web Inspector).
The latter, however, is not possible. Even if Chrome and Edge use the webkit webview on iPhone, Apple just doesn't let you connect to these webviews from your Mac. Because the webview-version of webkit is subtly different from the version of webkit that powers Safari, it's possible for your webpage to work in Safari but not in Chrome or Edge, even on the same iPhone.
Thankfully, here is a way to at least see your console logs from these browsers, which is better than nothing:
- In Chrome or Edge on iPhone, open a new tab and go to
about:inspect. - Click Start Logging.
- Keep this tab open and open a new one.
- In the new tab, go to the site that you need to test and run the user scenario that will trigger a the console logs you need to see.
- Return to the previous tab. Your logs are now displayed on the
about:inspectpage.