183 DevTools Tips
-
See quick accessibility information on hover
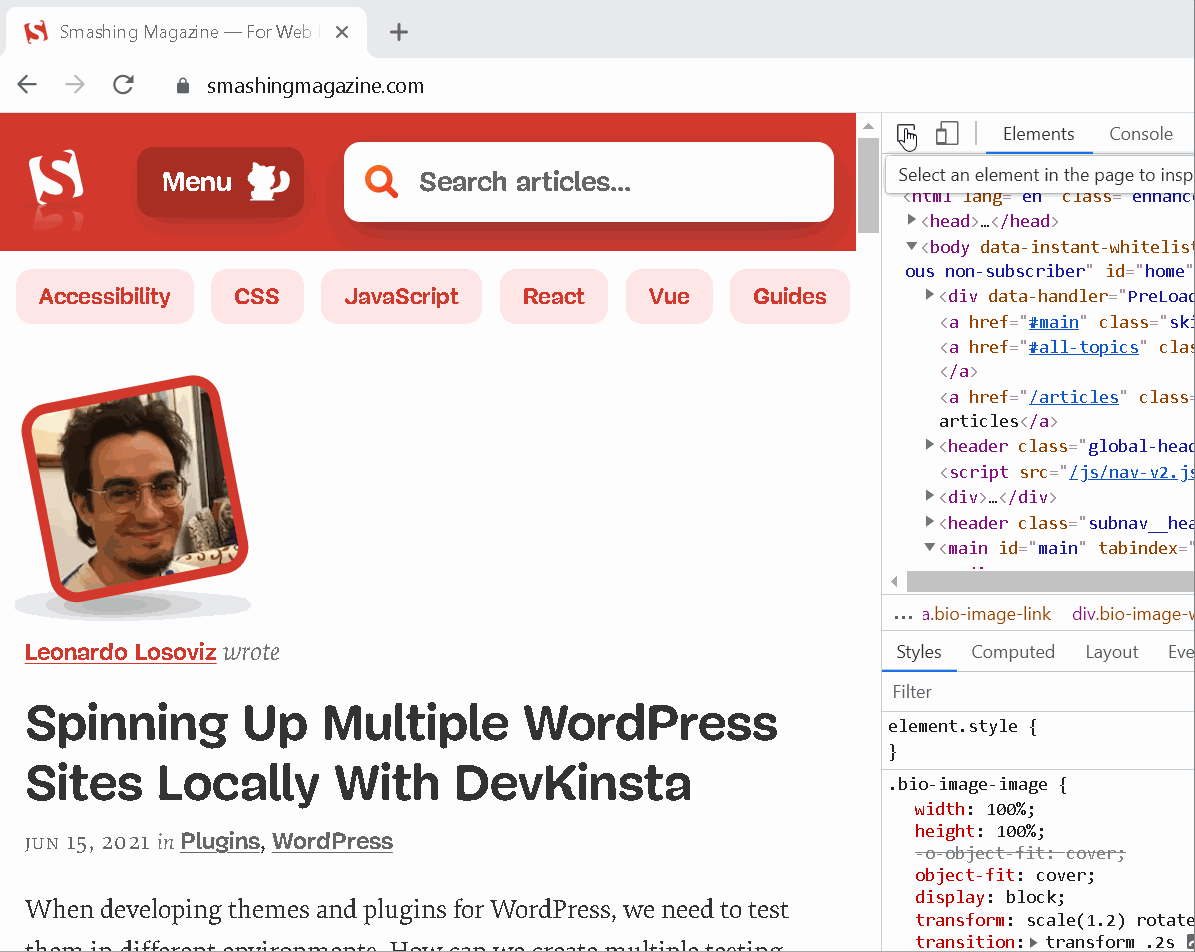 In Edge, Polypane and Chrome, whenever you use the element selector and hover over elements in the page, a tooltip appears with, among other things, some accessibility information about the hovered el... Read more
 -
Filter requests in the Network panel by status code, mime type and more
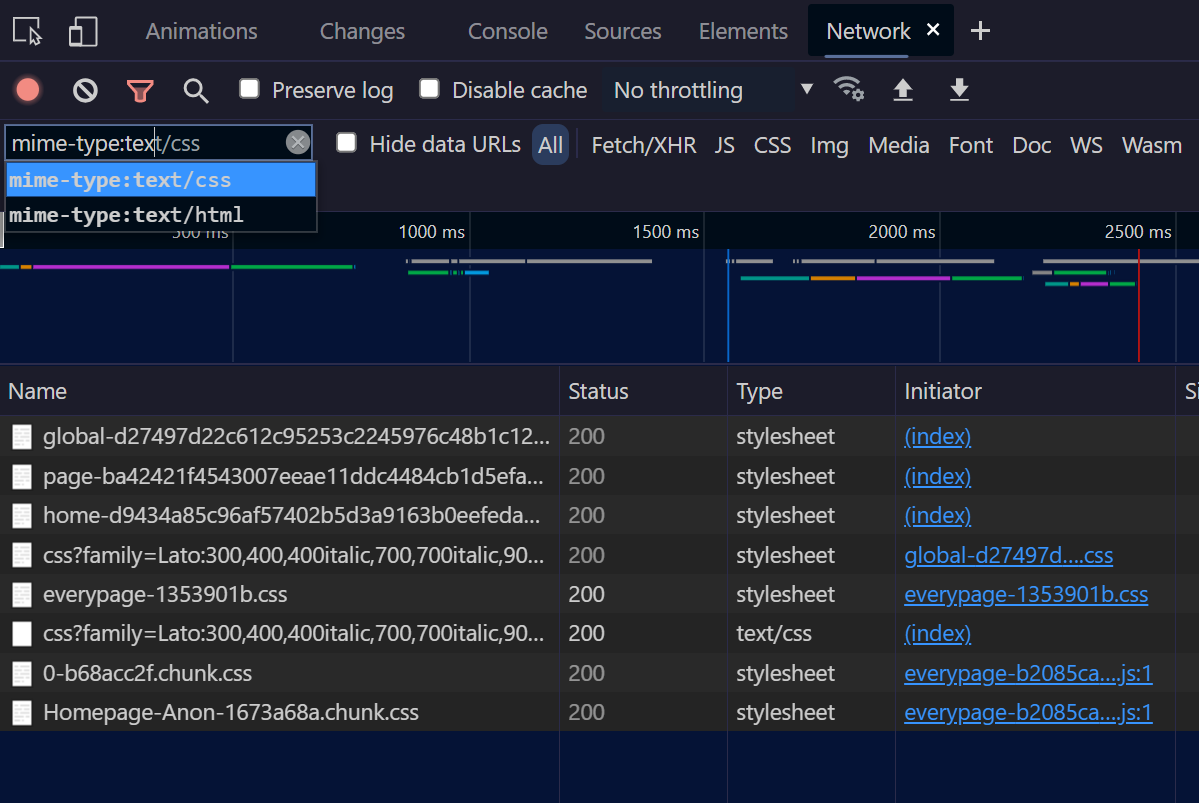 The Network panel lets you filter requests by status code, or mime type, and more. Click in the filter input field in the toolbar. Start typing status-code, you should see an autocomplete popup letti... Read more
 -
View performance markers in order
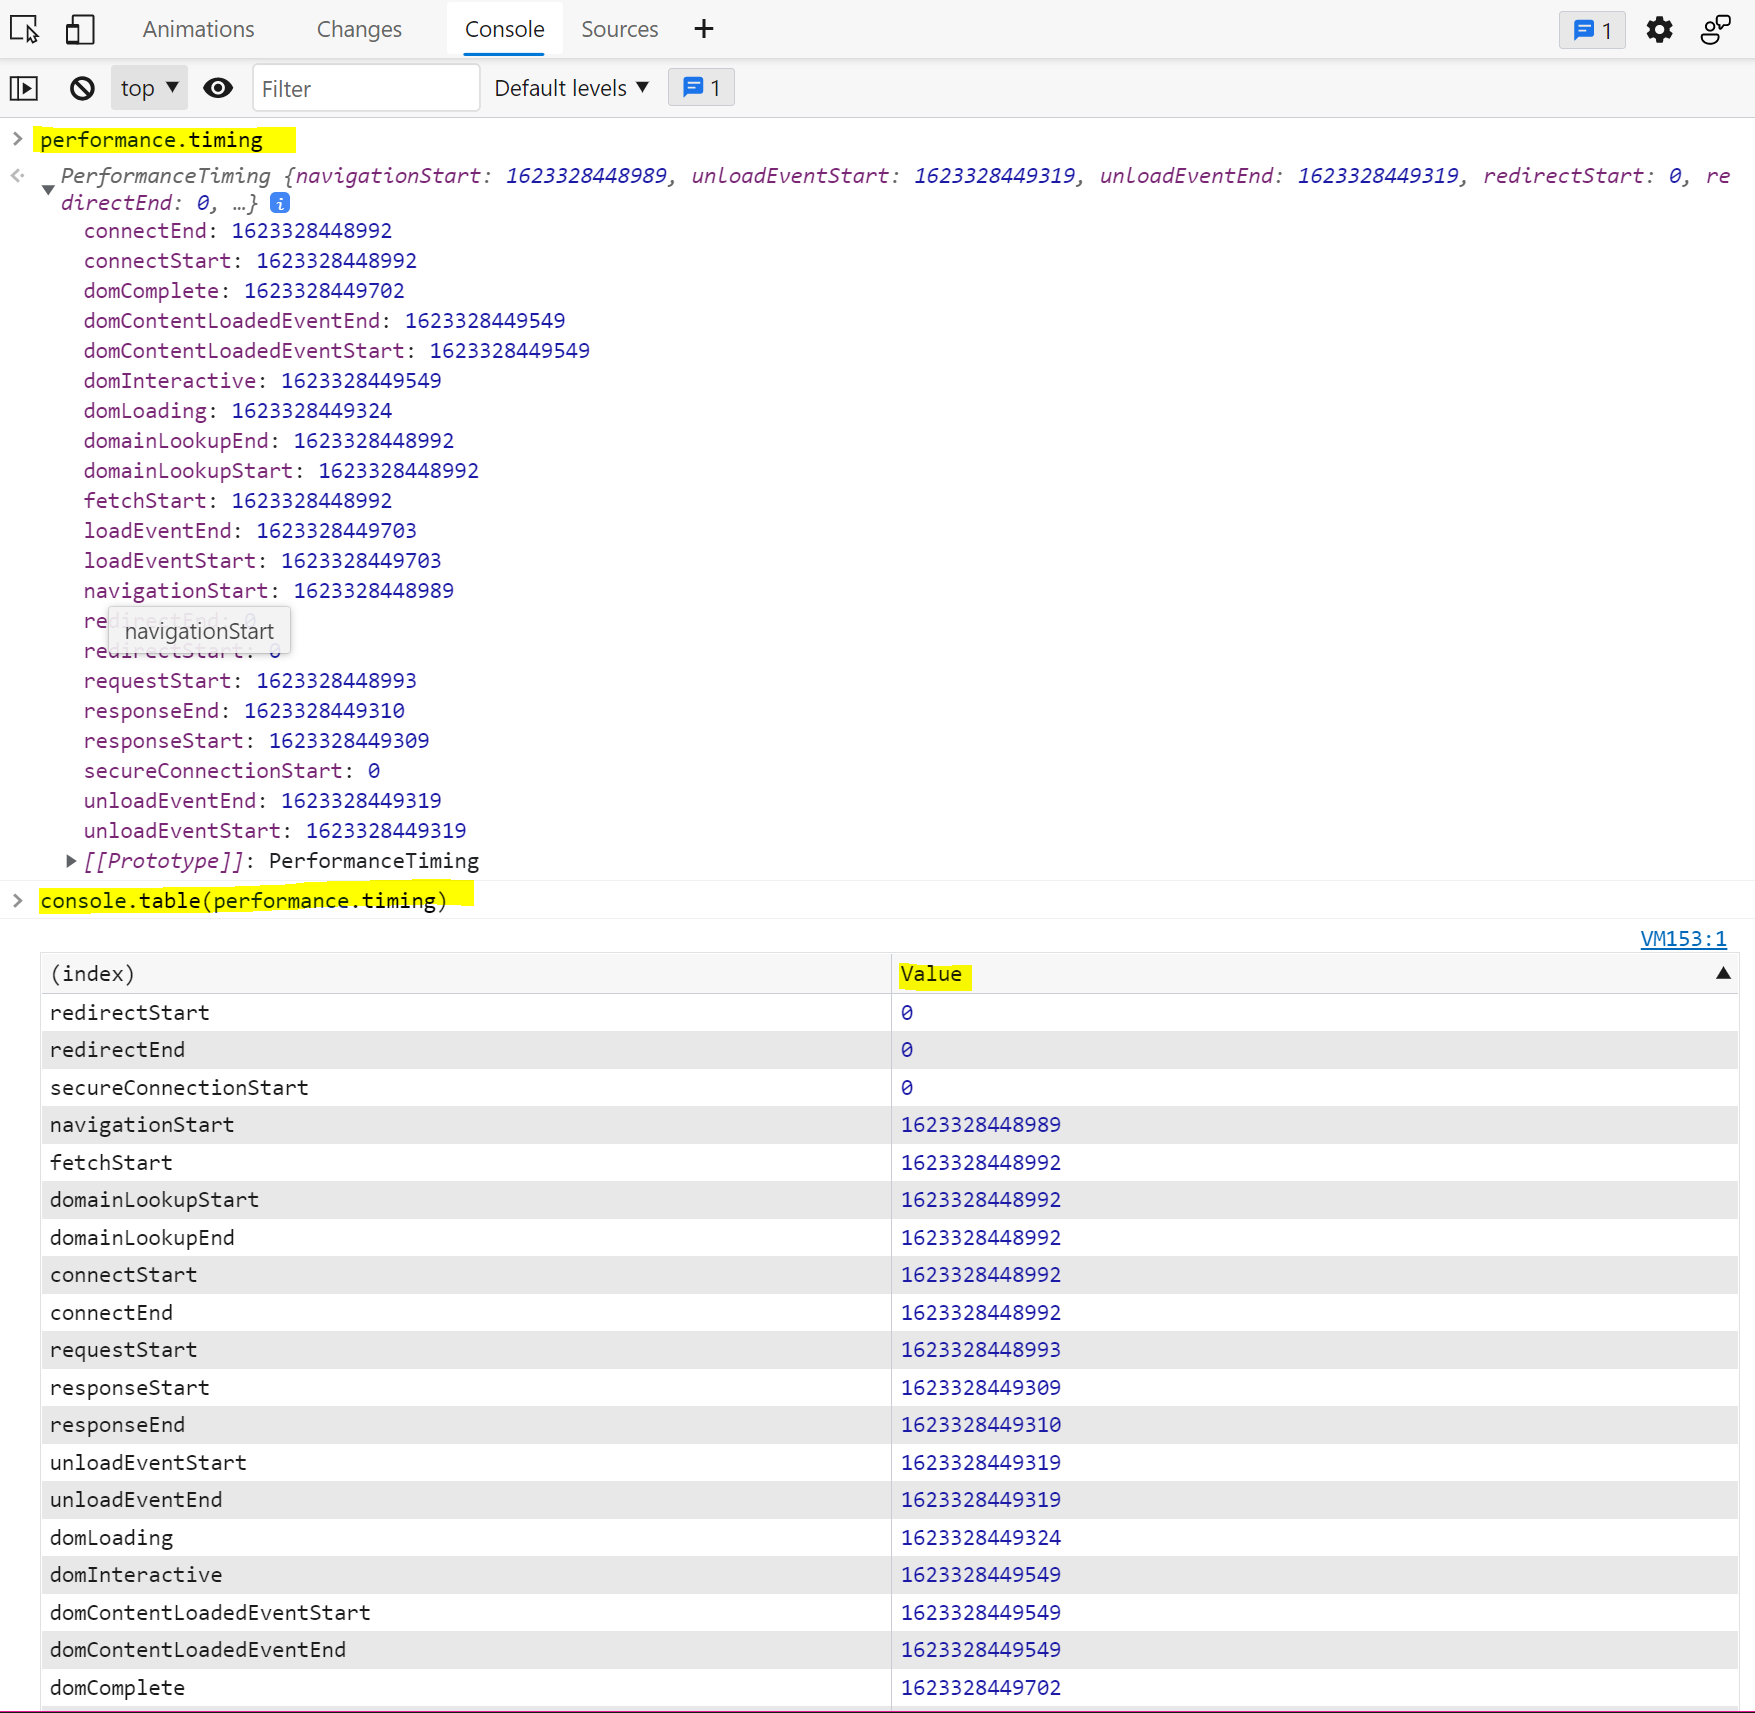 When logging performance.timing events to the console, they appear in alphabetical order since they are properties of the PerformanceTiming object. In order to view them in order, you can use console.... Read more
 -
Unminify JavaScript code to easily read and debug it
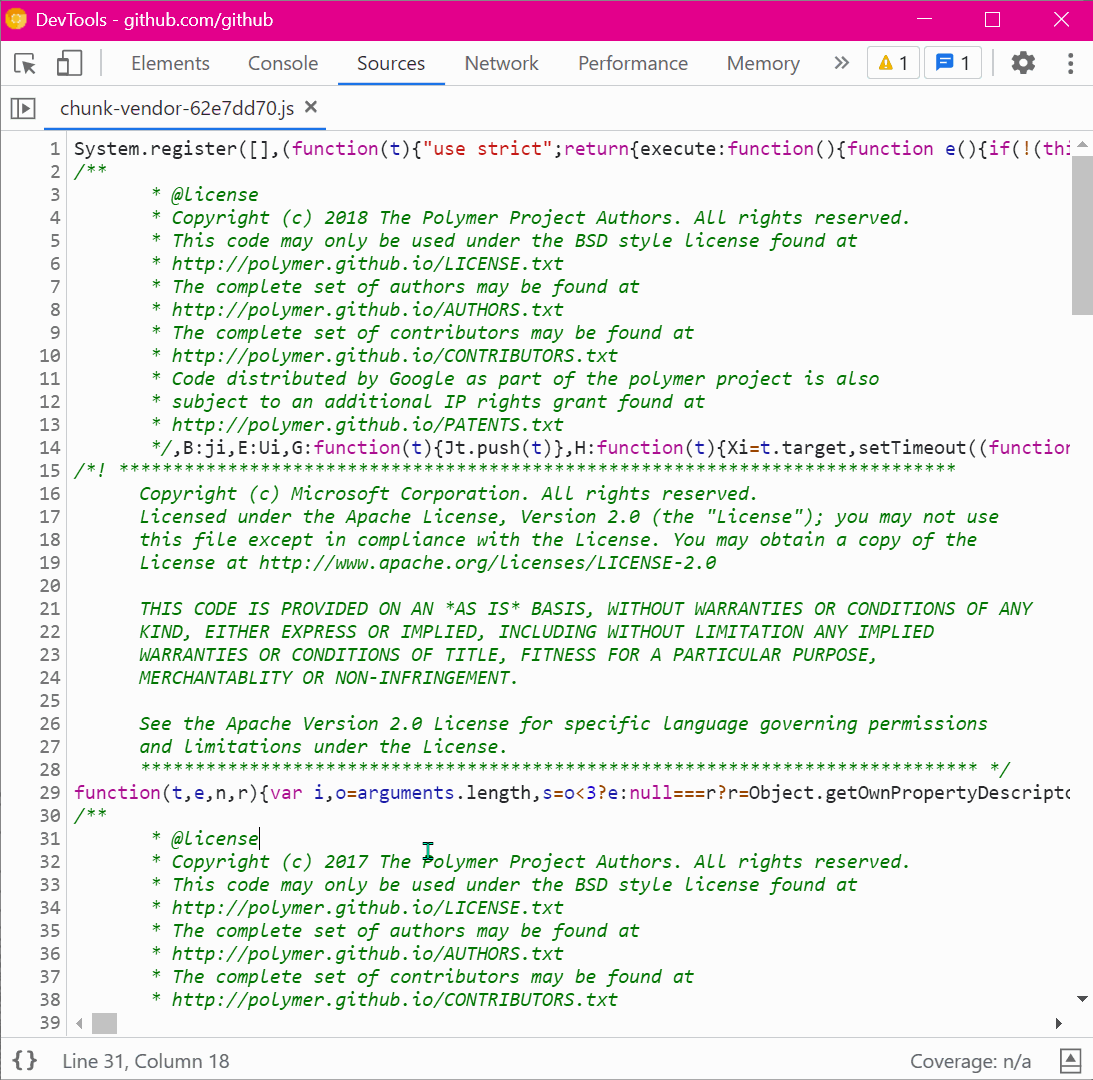 Sometimes, the JavaScript code that runs on a website is minified and really hard to read. This is common in production. You can unminify code in DevTools to read it more easily, and also set breakpoi... Read more
 -
Highlight all the elements that a CSS rule matches
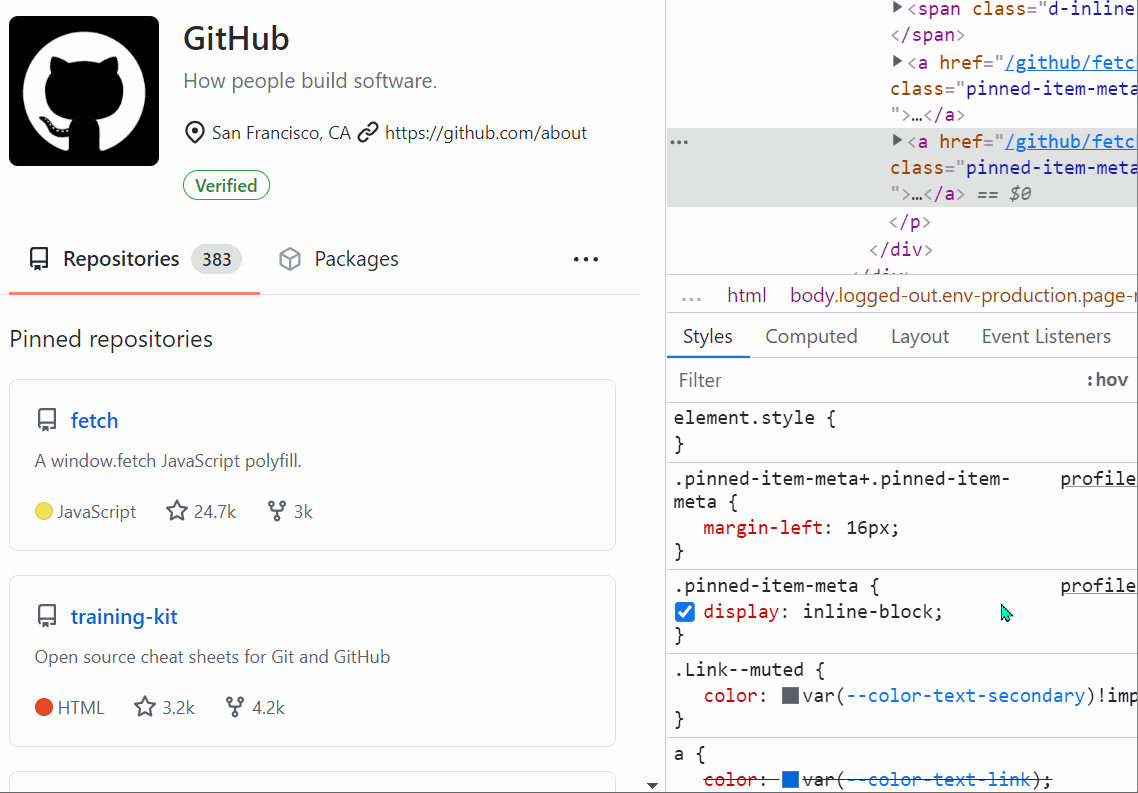 When you want to know which elements a given CSS rule will apply to, in addition to the currently selected element, you can: In Firefox: In the Style Editor panel: hover over any rule selector for s... Read more
 -
Expand DOM nodes recursively
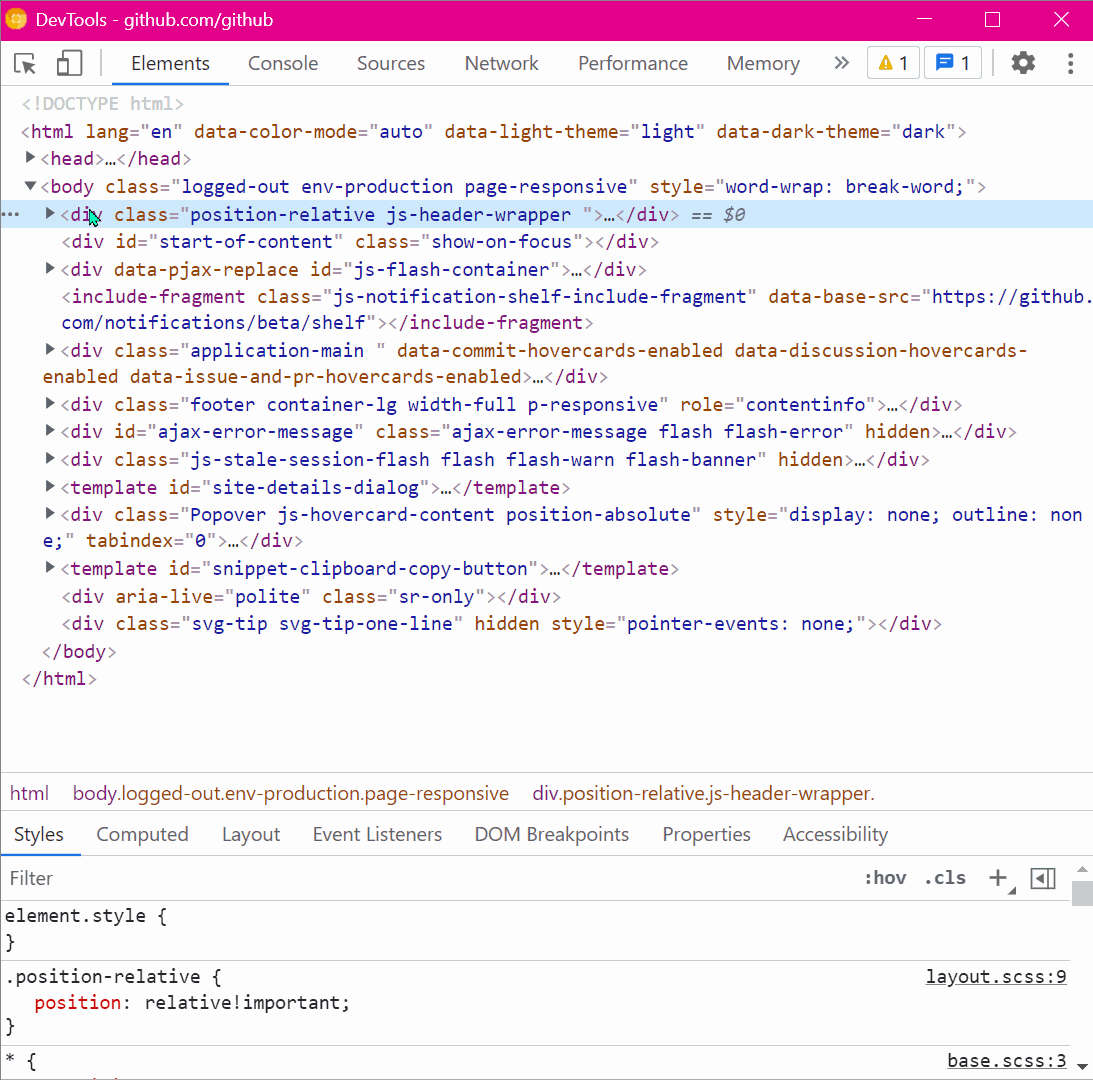 You can expand all descendants under a given DOM node in one go, to avoid having to expand each node one by one, which may take a while. In Chrome and Edge Right-click on the node you want to expand... Read more
 -
Edit CSS filters
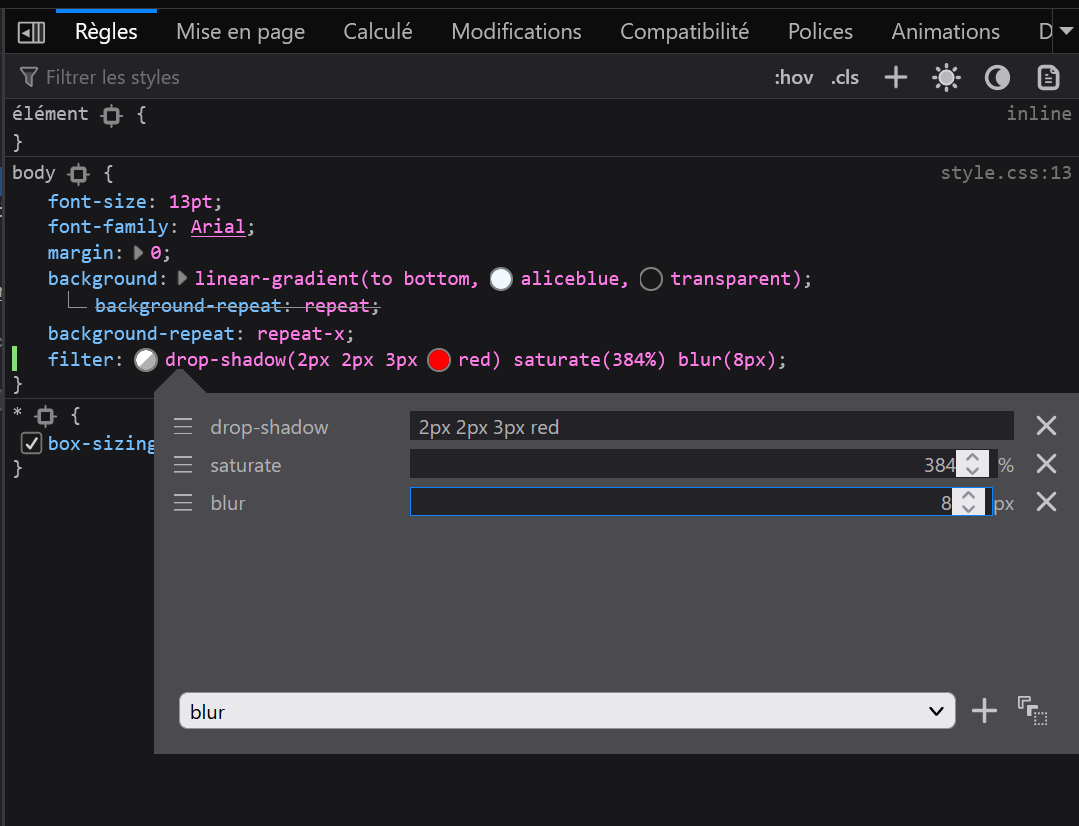 The filter property in CSS lets you change the way a particular element gets rendered. Firefox provides a visual editor to play with CSS filters. You can add or remove filter functions from the list,... Read moreCategories: Supported by:
 -
Use the debugger statement to pause script execution
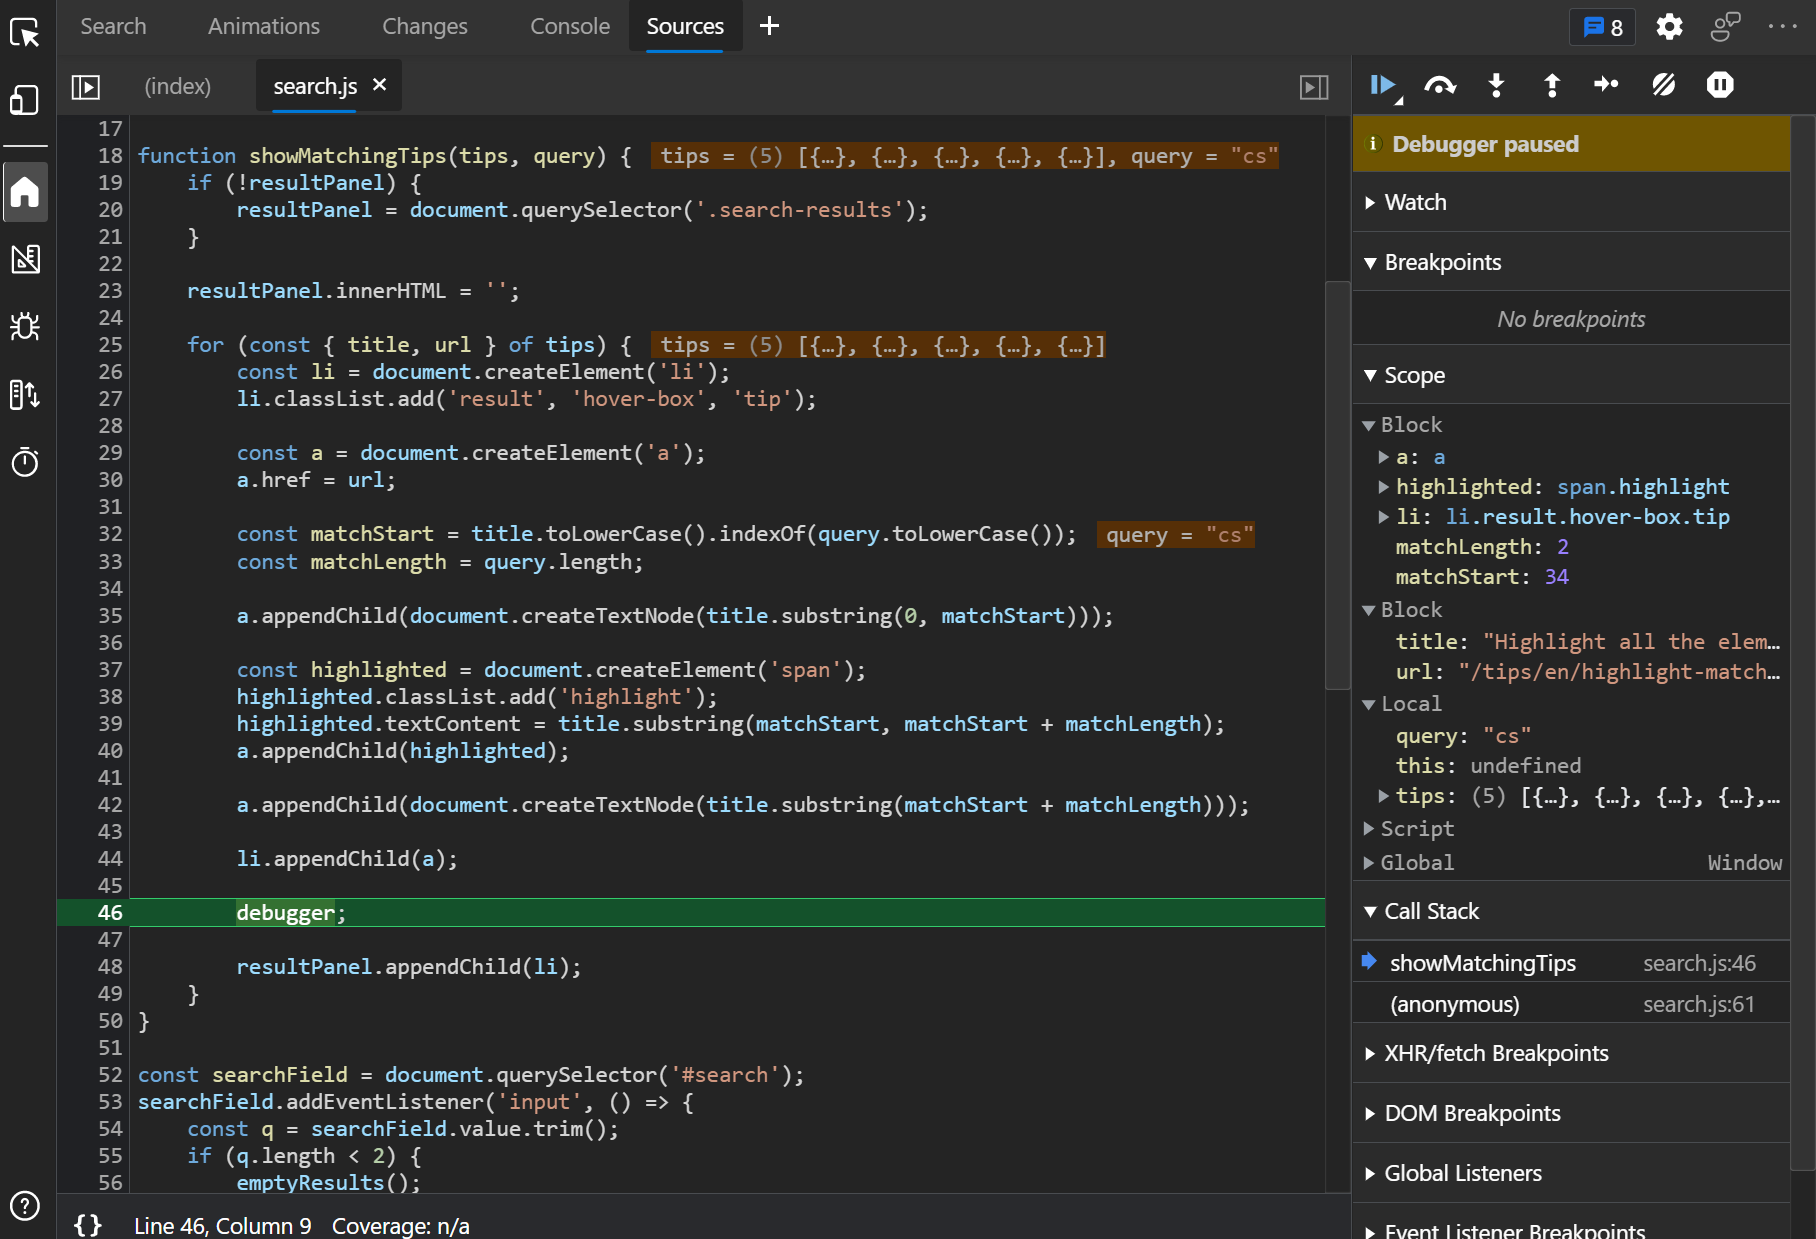 If you prefer to use console.log() statements rather than the JavaScript debugger because you find it difficult to set breakpoints in DevTools (or you can't), then you can use the debugger statement i... Read more
 edge
edge
 chrome
 polypane
 firefox
 safari