184 DevTools Tips
-
Edit JavaScript functions while debugging to test a quick fix
 Sometimes, when debugging JavaScript code in DevTools, you may want to test a quick change and see whether that fixes the bug. Usually, this involves the following steps: Pause at a breakpoint, or an... Read more
 -
Install or create extensions to customize DevTools
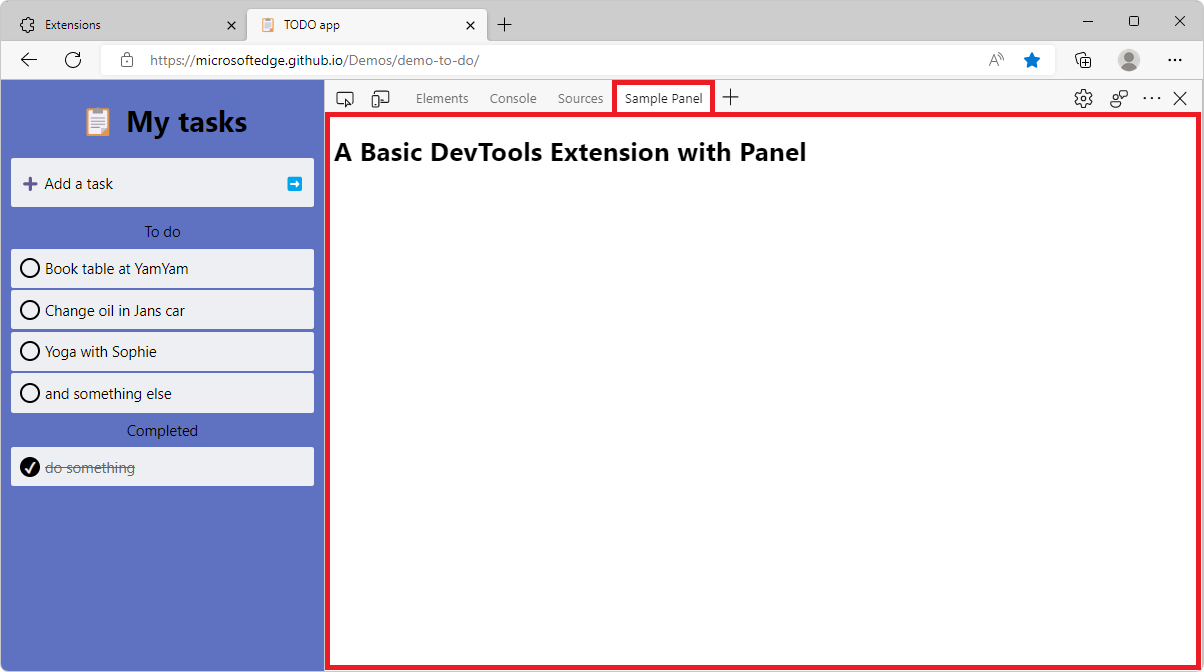 There's a lot of tools in DevTools already, probably more than you use. But in some cases, you may need very specific tools that aren't available by default. Thankfully, DevTools can be extended with... Read more
 -
Use DevTools in another language
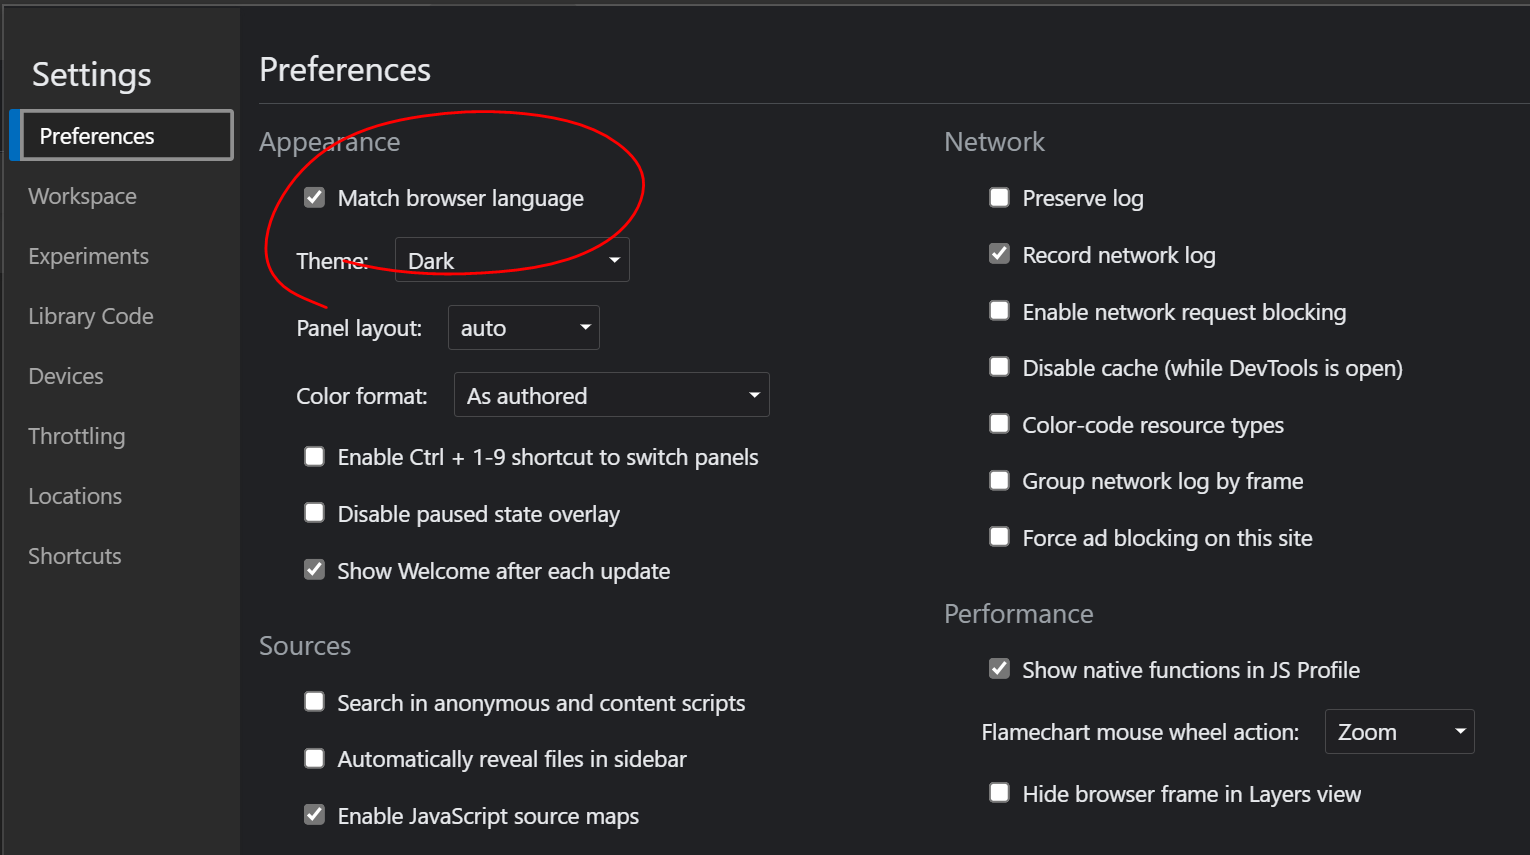 If you want to use DevTools in another language than English, you can do it across all major browsers. In Firefox, DevTools will always match the language of the browser, so if you downloaded Firefox... Read more
 -
Access results from recent Console evaluations
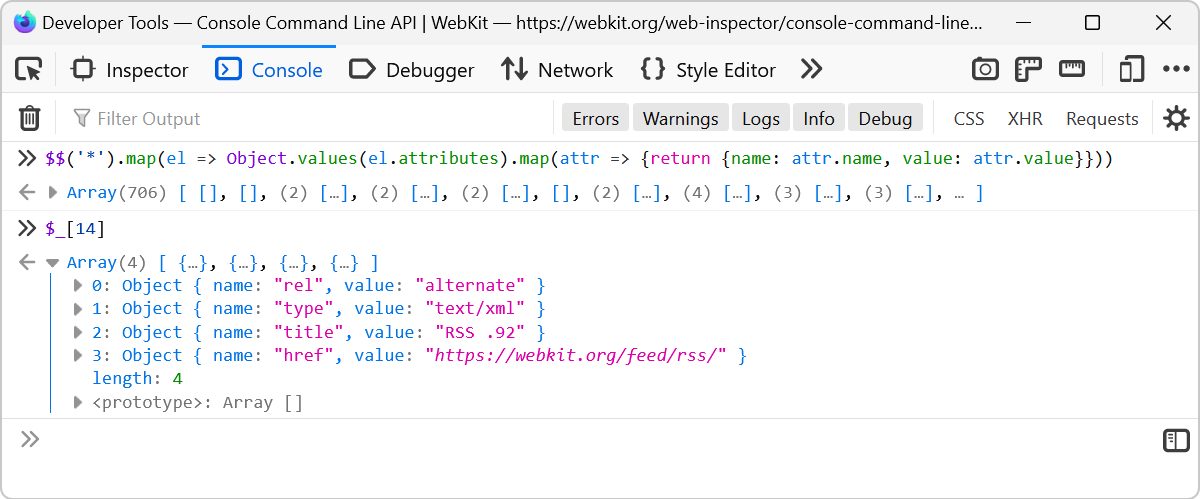 Imagine you evaluate a long expression like $$('*').map(el => Object.values(el.attributes).map(attr => {return {name: attr.name, value: attr.value}})) which extracts the attributes from all of t... Read more
 -
Simulate a different latitude/longitude geolocation
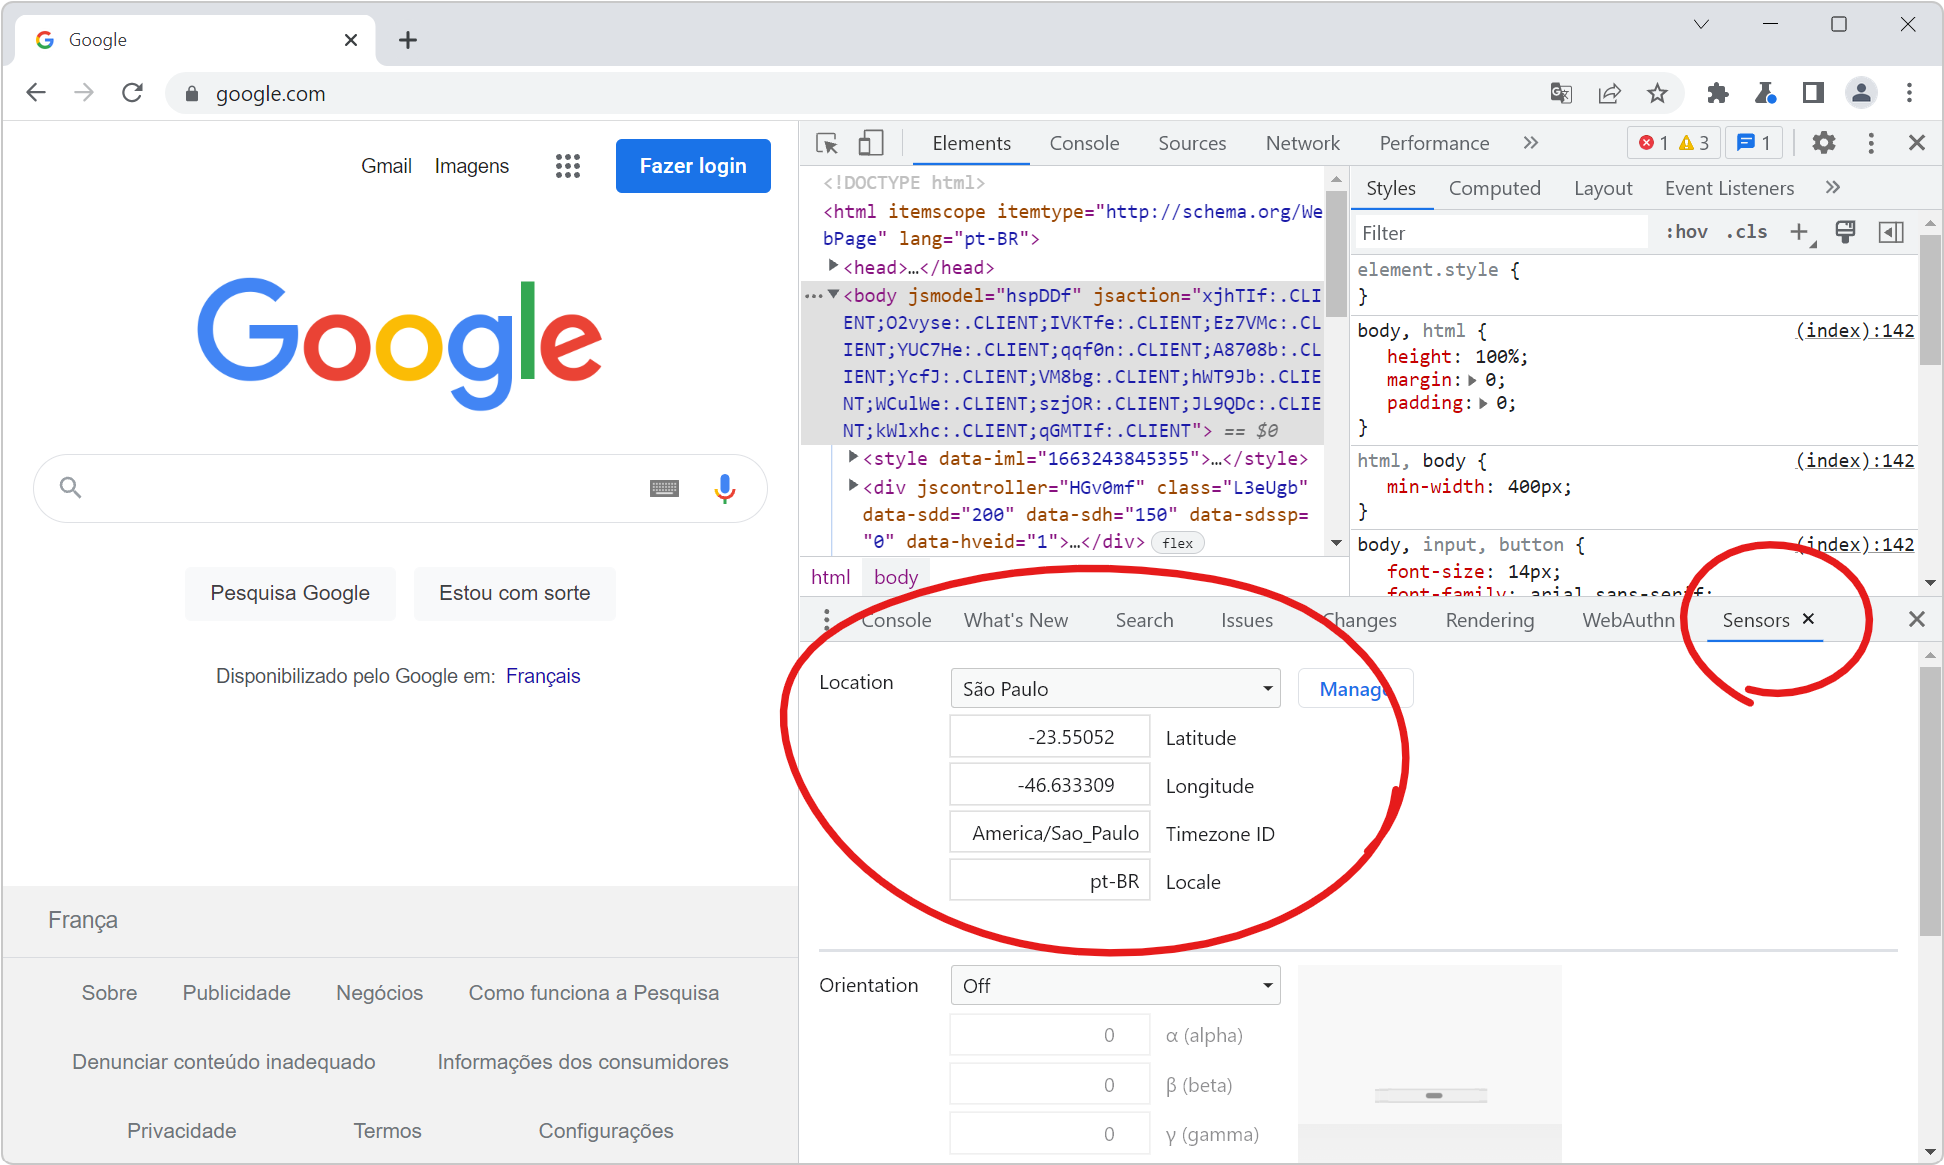 If your website has features that depend on the geographic location of your users, you can test these features by simulating different geolocations right from DevTools! Chrome and Edge DevTools have a... Read more
 -
Find inactive CSS styles
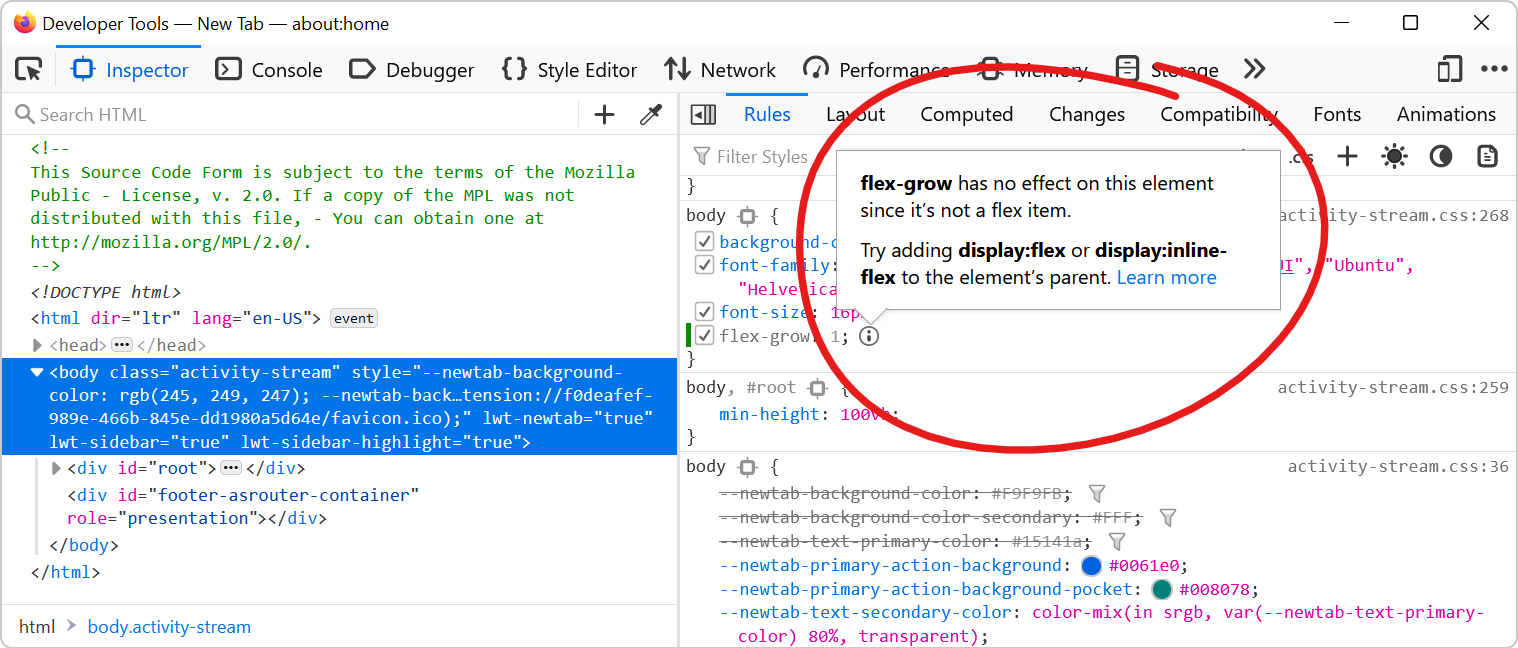 Sometimes we write CSS code that's entirely valid but has absolutely no effect at all, and this can be frustrating. Indeed, there are many cases where a CSS declaration has no effect on an element. On... Read more
 -
Get the recently selected DOM nodes in the console
 If you type $0 in the Console tool, in any browser, the currently selected DOM node is returned. This is very handy. To learn more, check Get the selected element in the console. On top of this, in Ed... Read more
 -
Inspect CSS animations
 Modern browser DevTools provide a handy tool to inspect and modify CSS animations, CSS transitions, and Web animations. These tools not only help you debug animations, but also let you modify the vari... Read more
 -
Remove annoying page overlays and other elements
 A lot of websites these days get covered with overlays and crammed with lots of ads and other things that make it hard to just read the content of the page. To get rid of an annoying overlay, or any o... Read more
 -
Copy CSS selector of an element
 To uniquely identify an element that lacks an identifier, so that you can reference the element in JavaScript and other places, use DevTools' ability to copy unique CSS selectors. All DevTools have th... Read more
 -
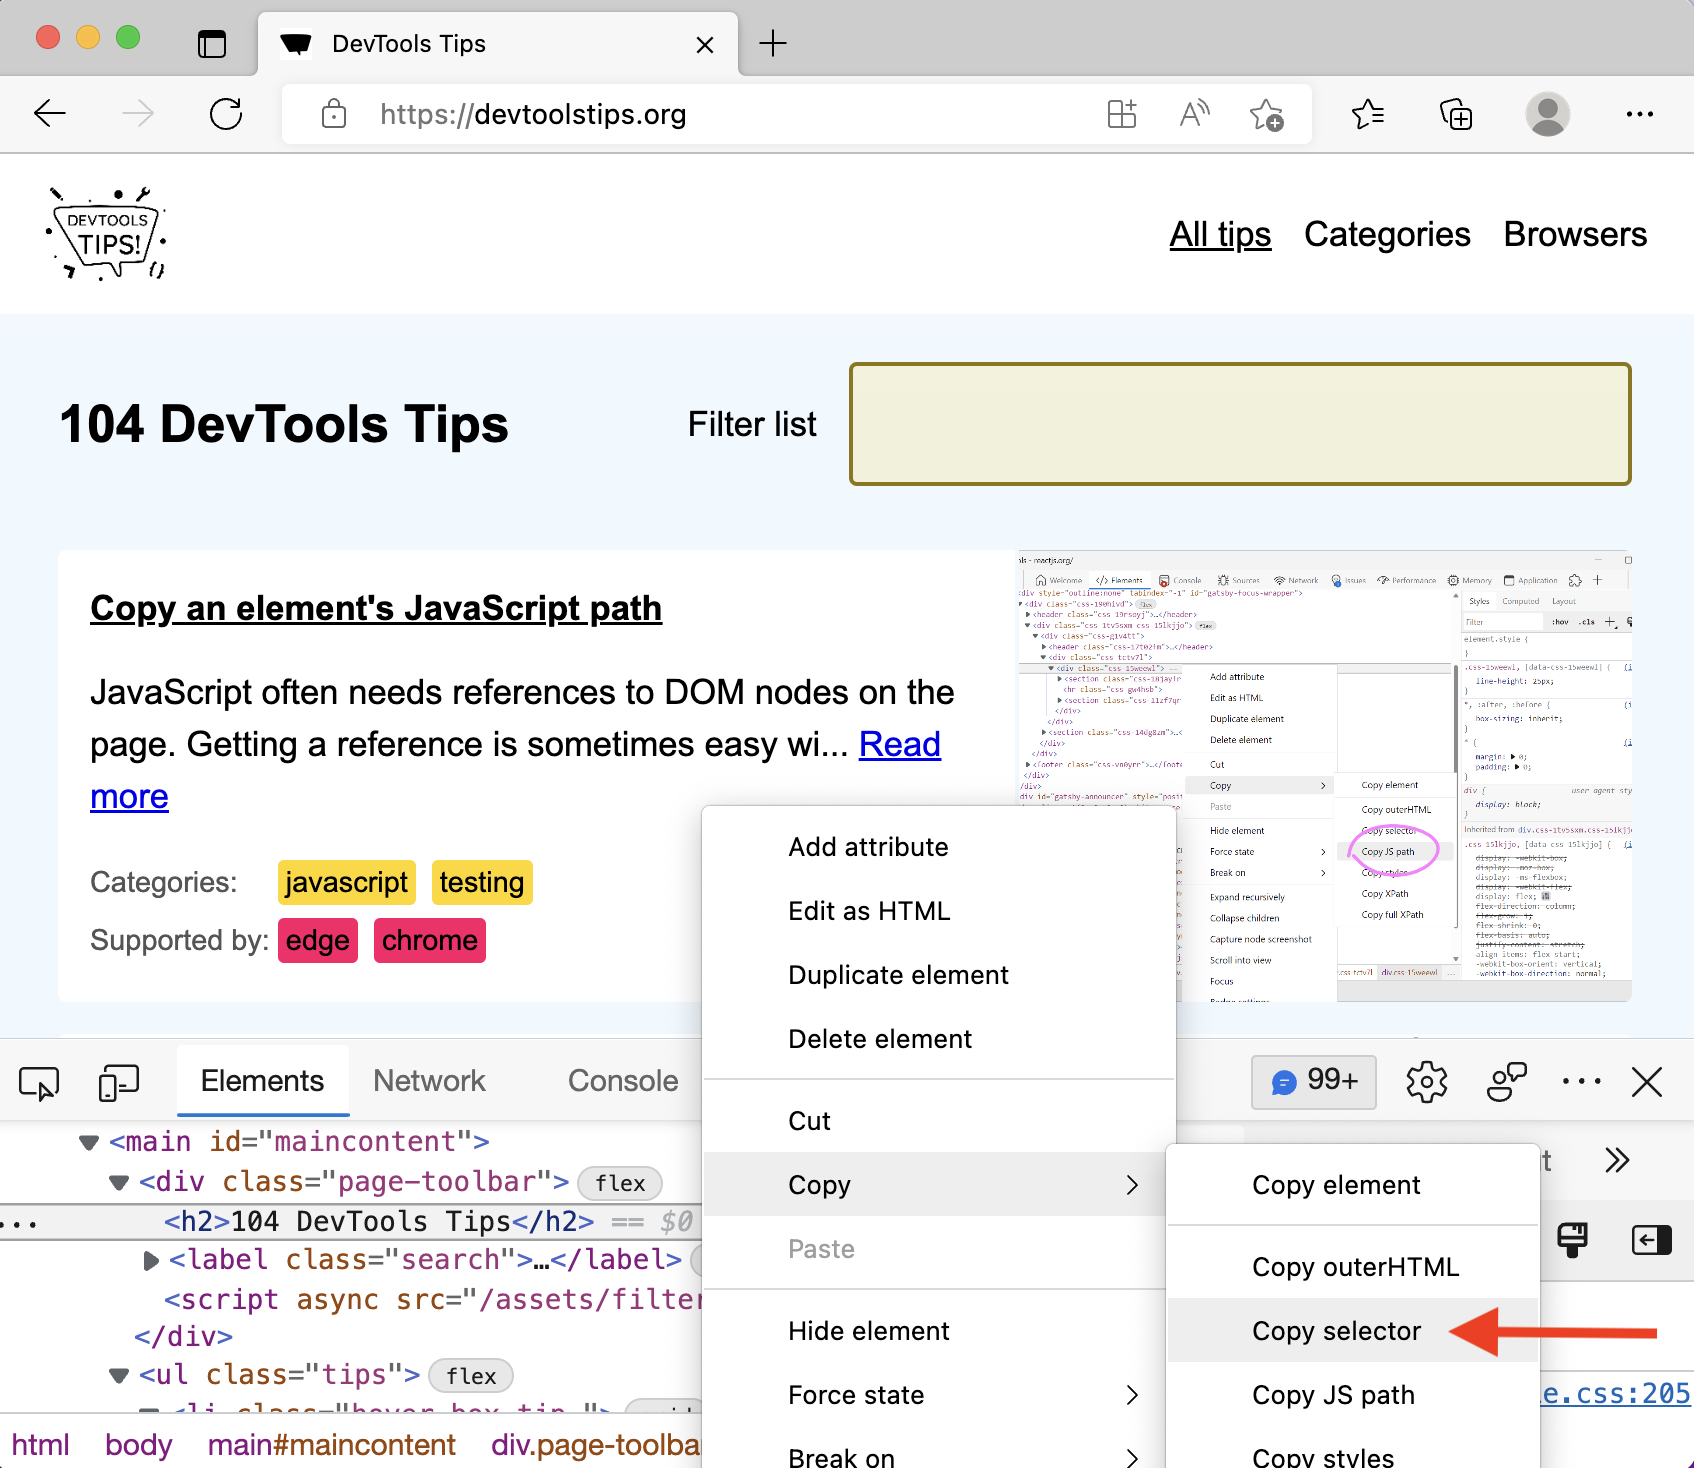
Copy an element's JavaScript path
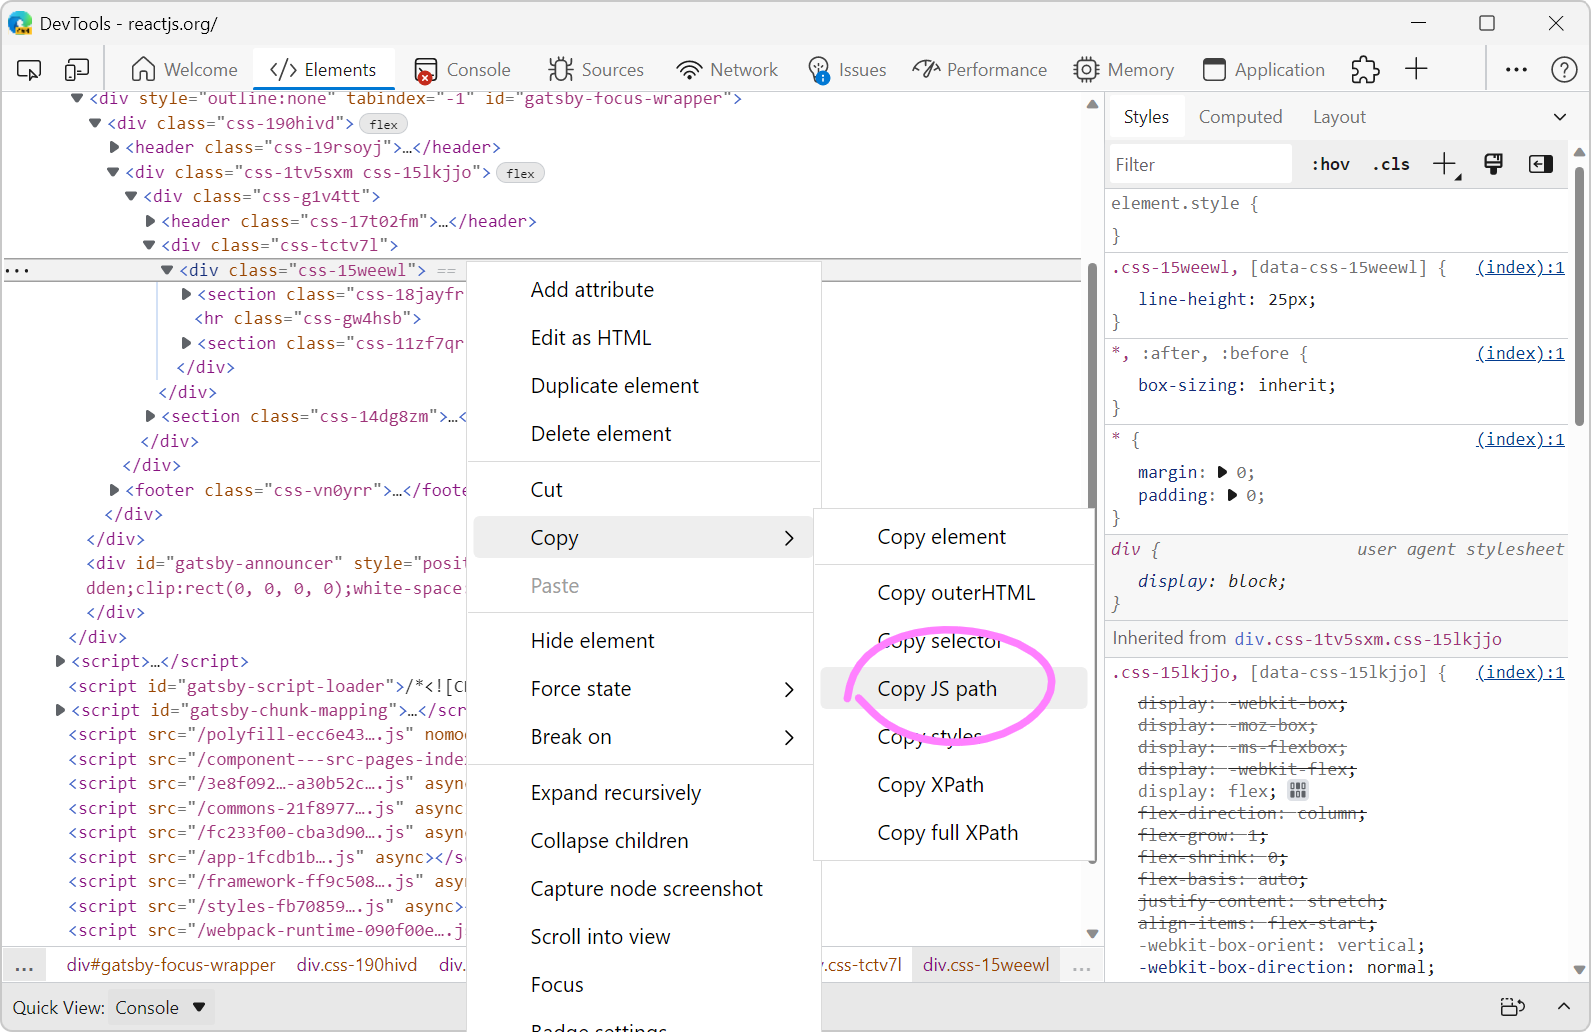 JavaScript often needs references to DOM nodes on the page. Getting a reference is sometimes easy with document.getElementById() or similar. Other times however, a more complicated CSS selector needs... Read more
 -
Jump from a label `for` attribute to the linked input (and more)
 In HTML, it's possible for certain attributes to reference other elements by their IDs. For example, a <label>'s for attribute can be used to link the label to the input it's associated with: &l... Read more
 -
Fix color contrast issues using the element tooltip
 There are multiple ways to detect and fix color contrast issues with DevTools, but here is a nice one to keep in mind. It's not straightforward to use and takes a few steps, but makes it very nice to... Read more
 -
Empty the cache and hard refresh
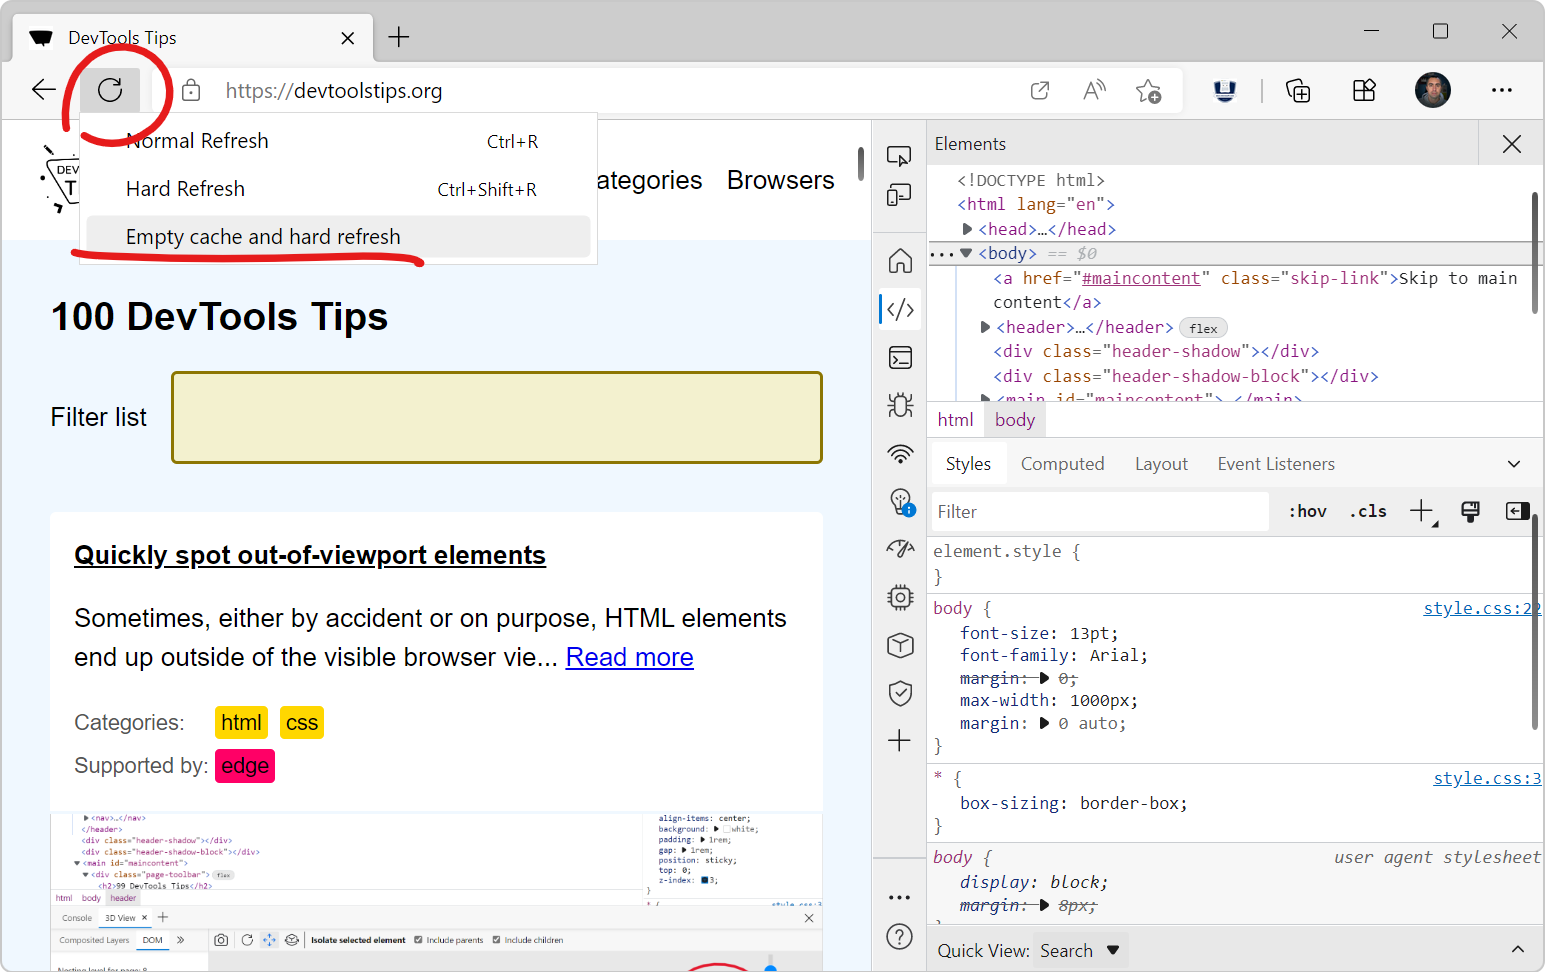 Here is a nice tip to quickly empty your cache and refresh the page, in order to test new code changes: In Chrome, or Edge, open DevTools (F12). This step is not needed for Polypane. Right-click on t... Read more
 -
Quickly spot out-of-viewport elements
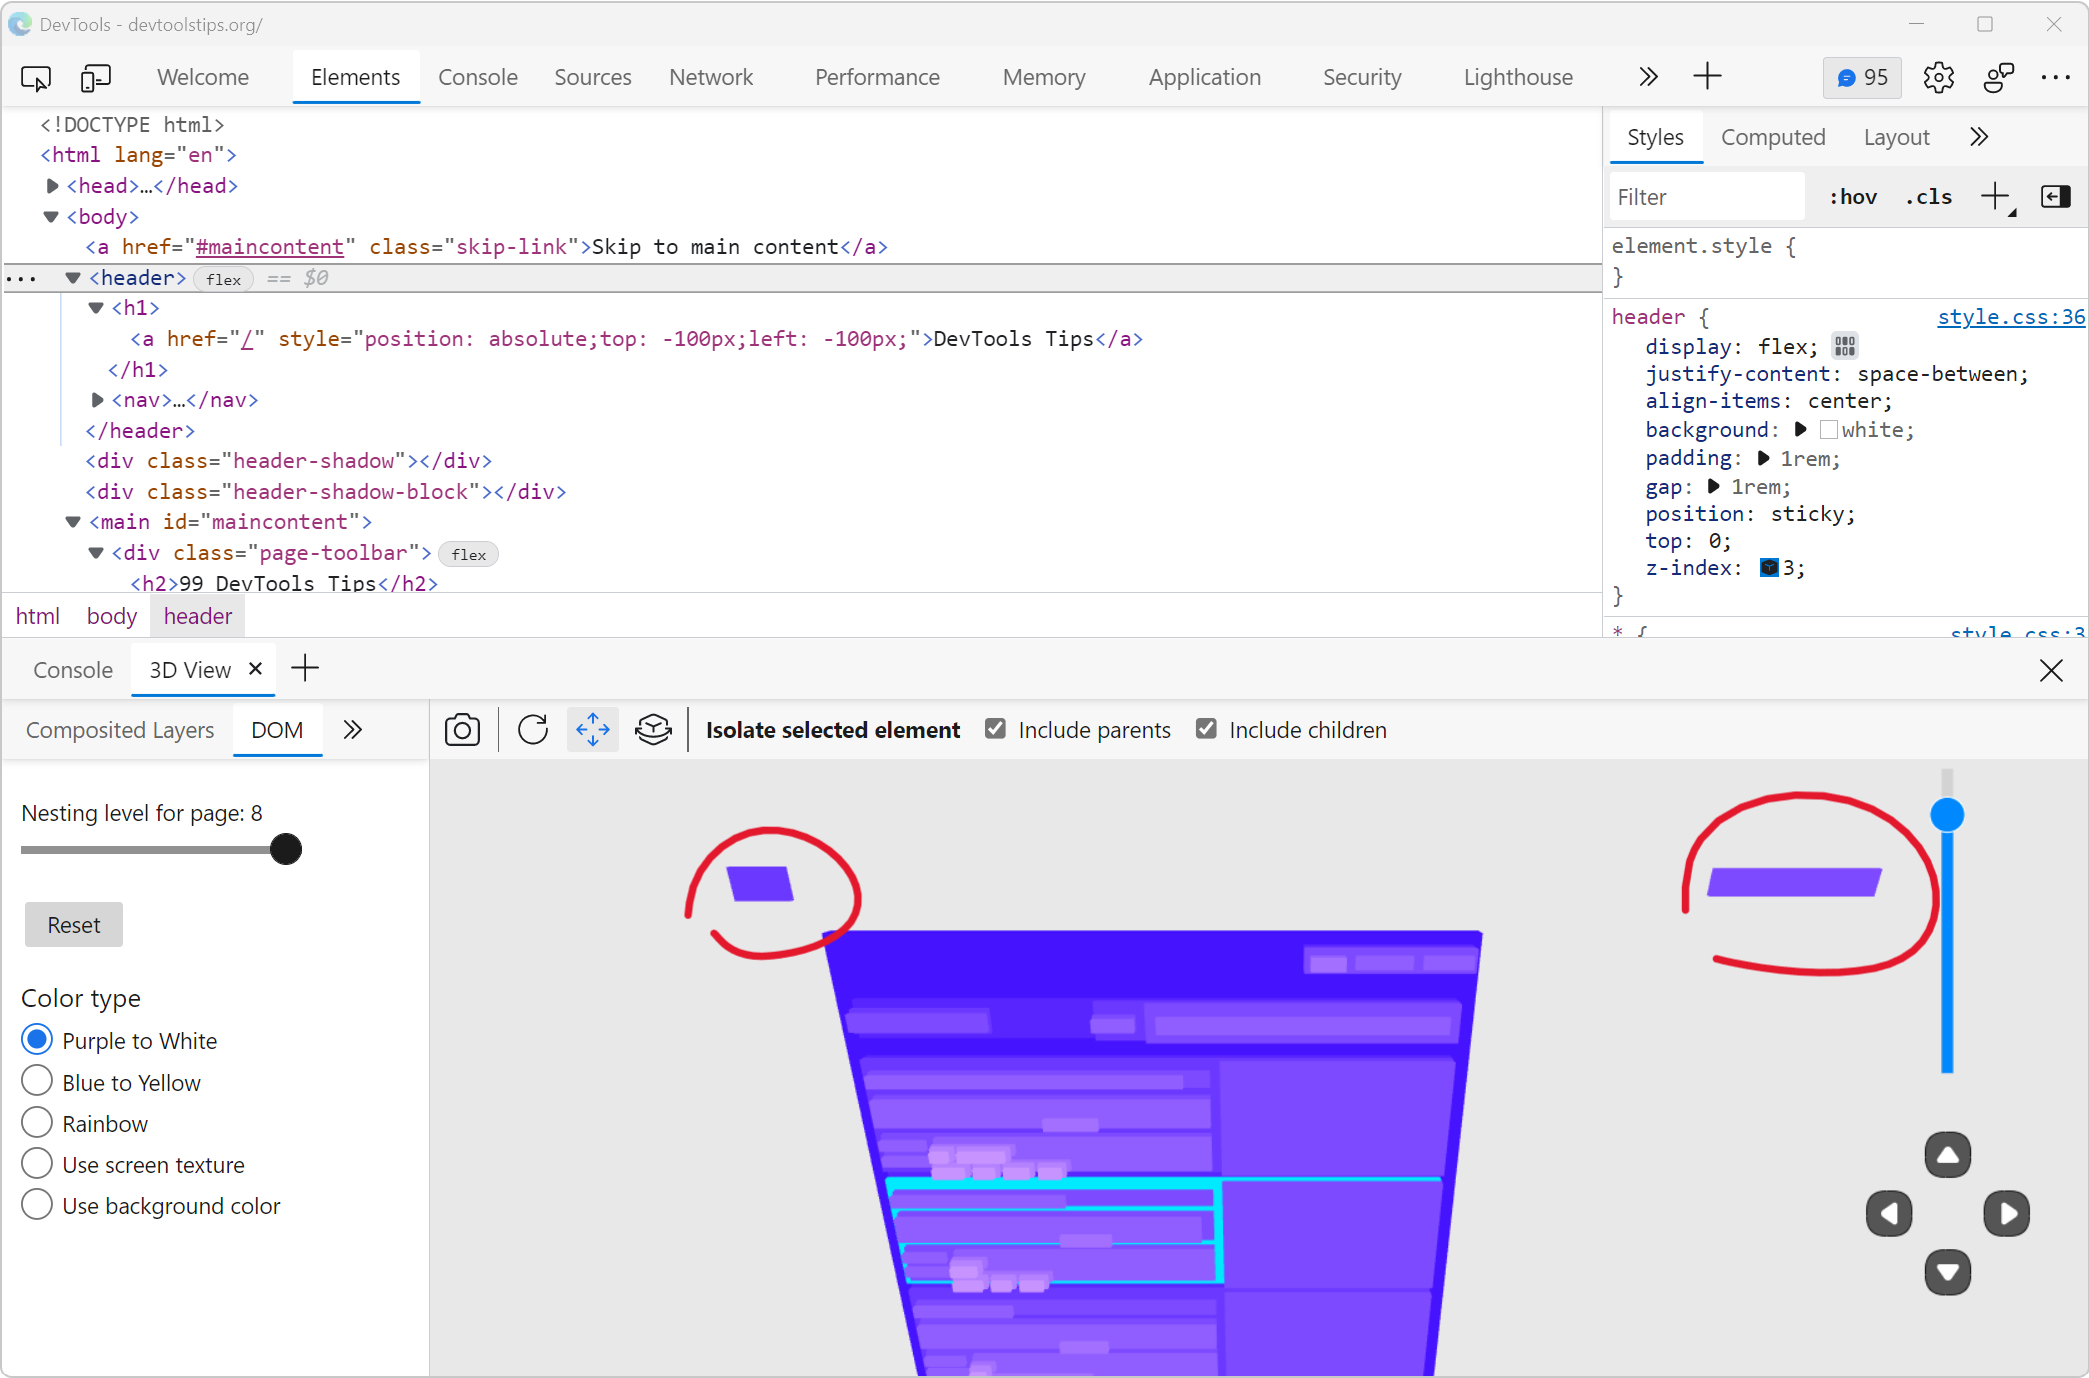 Sometimes, either by accident or on purpose, HTML elements end up outside of the visible browser viewport. When they do, it can be really hard to find them in DevTools. Indeed, the DOM tree in the Ele... Read moreCategories: Supported by:
 -
Edit an element's attributes and tag name with the keyboard
 Using the keyboard can be faster than using a mouse in certain cases (and for some people). One such case is editing an element's tag name and attributes in DevTools. To do this, select an element in... Read more
 -
Create your own simulated devices
 You can simulate various different devices from DevTools, to get an idea of how your webpage might render on those devices (note that this is only a simulation, the tool only changes the screen dimens... Read more
 -
Discover all the tools
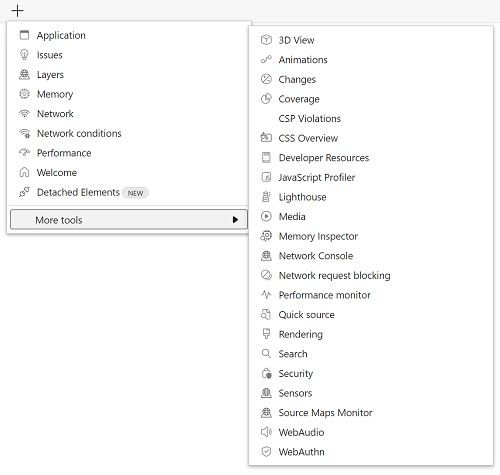 DevTools is confusing! There's so much functionality packed in such a small UI. Did you know that Chrome DevTools had more than 30 individual tools! Yes, that's right, 30. It's hard for both new users... Read more
 -
Copy an elements styles
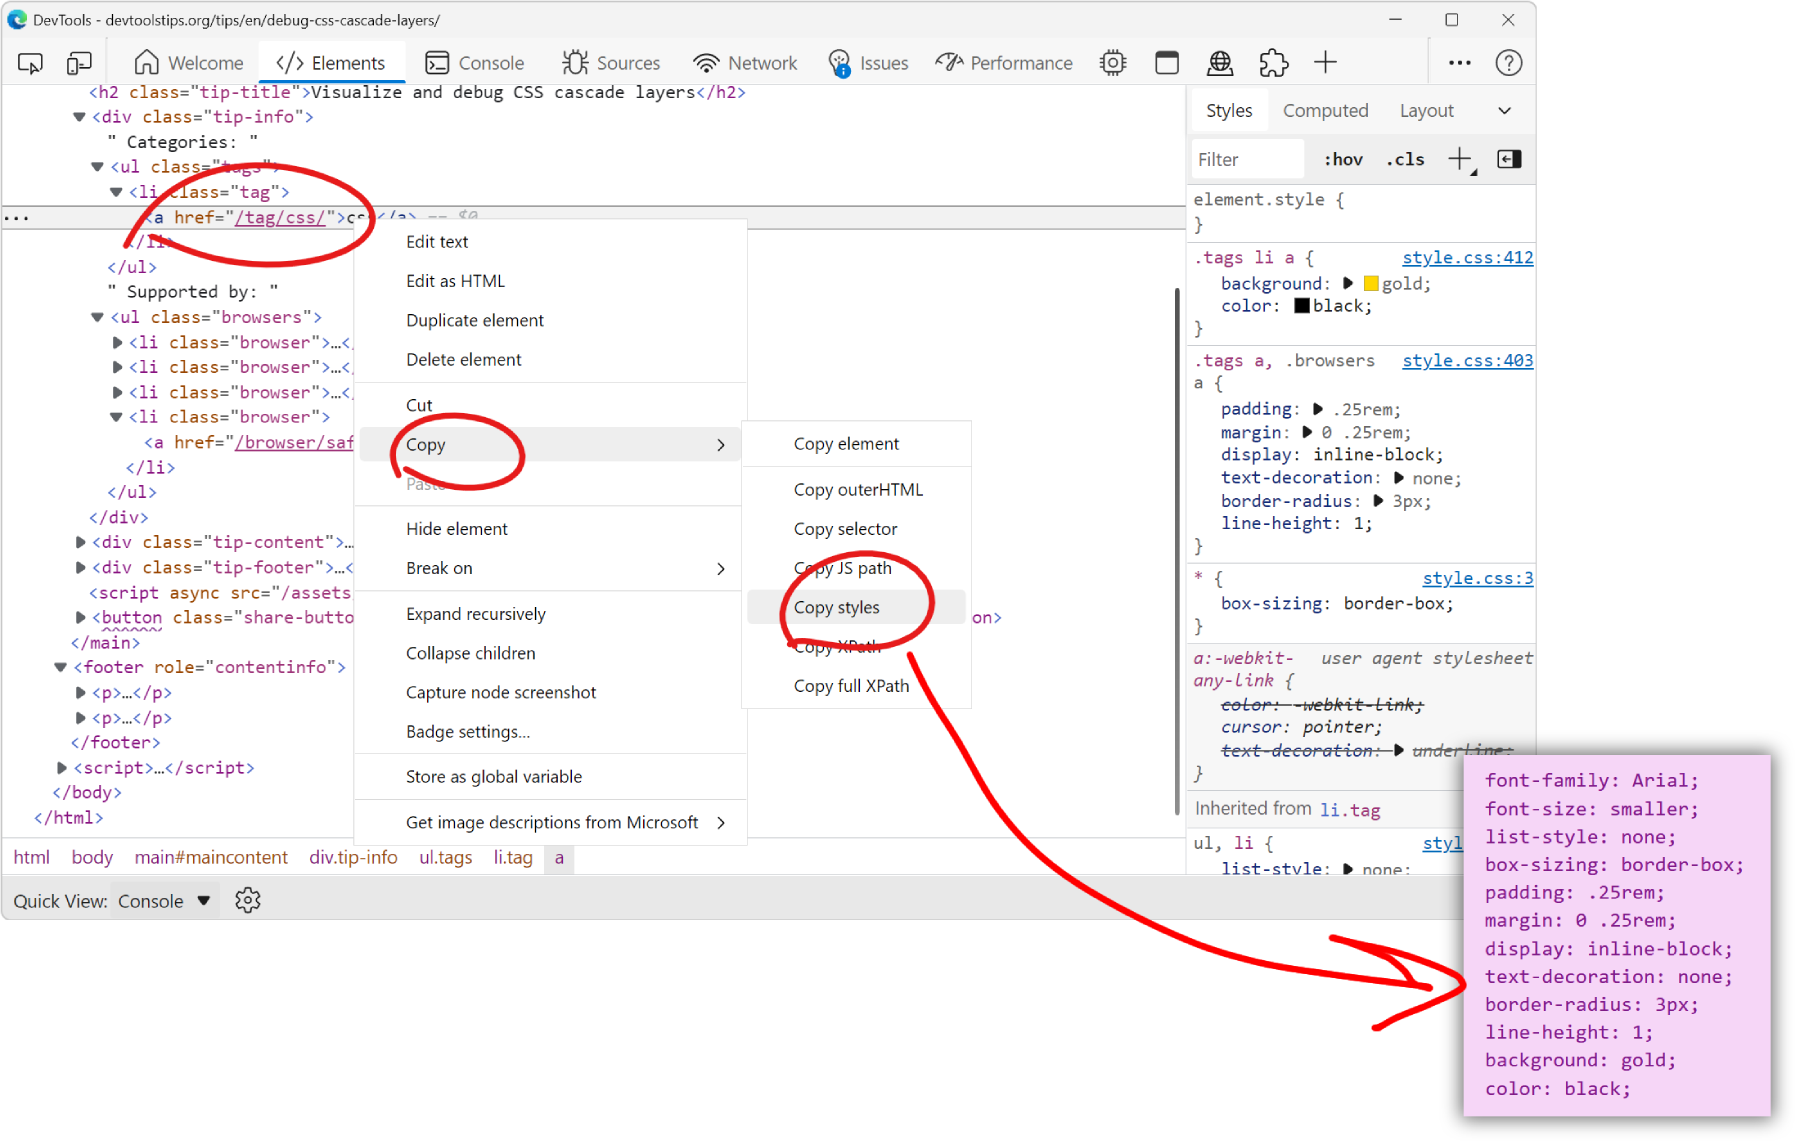 You can extract all the styles of an element in one go by using the Copy styles feature. No need to go through all CSS rules and properties that apply to the element in the Styles pane, and manually b... Read more
 -
Use document.designMode to spell check your webpage
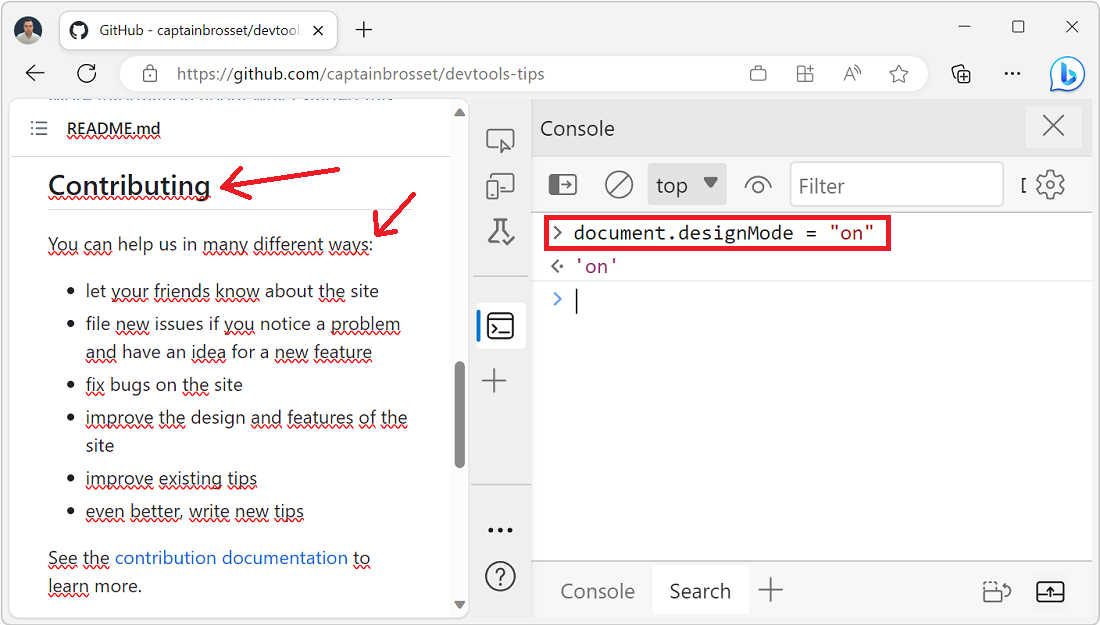 Amelia Bellamy-Royds shared a really cool tip to spell-check a webpage's content from DevTools: Open DevTools, and go to the Console tool. Type document.designMode = "on" and press Enter. C... Read more
 -
Visualize and debug CSS cascade layers
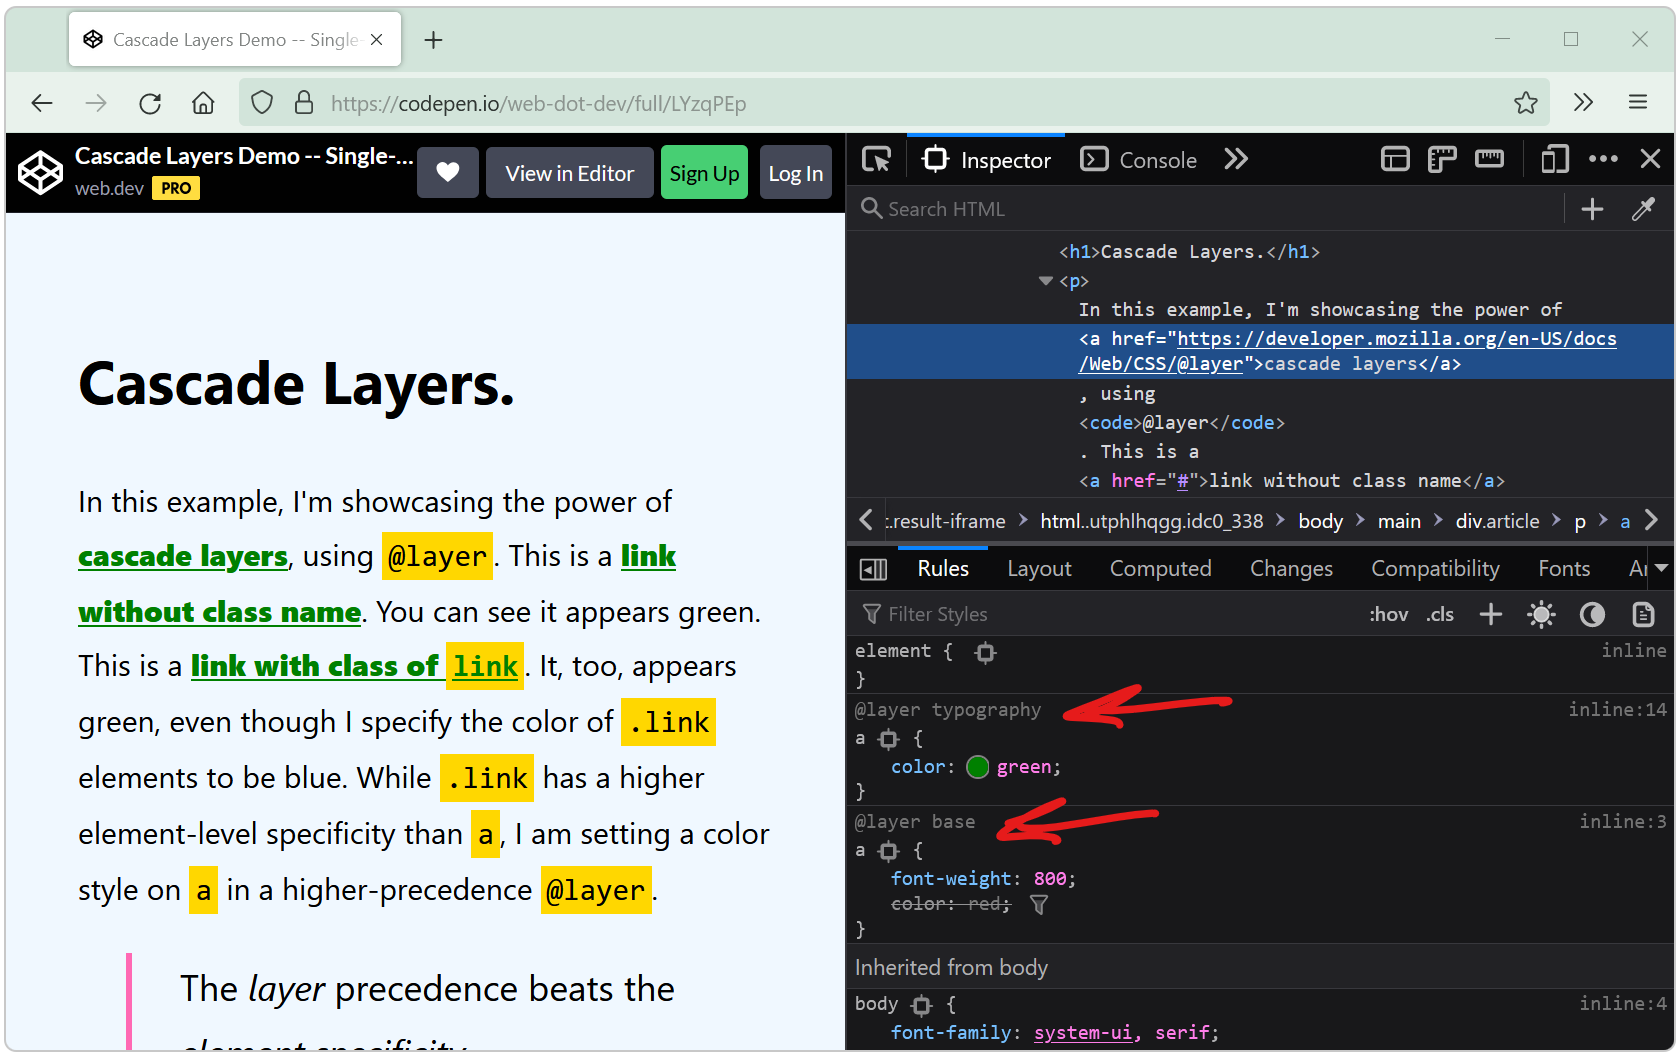 Cascade layers is a CSS feature that allows web developers to define their CSS styles in multiple layers and control the order in which these layers apply. Cascade layers are meant to bring an elegant... Read more
 -
Automatically get issues your site has with performance, accessibility, security, compatibility, and others.
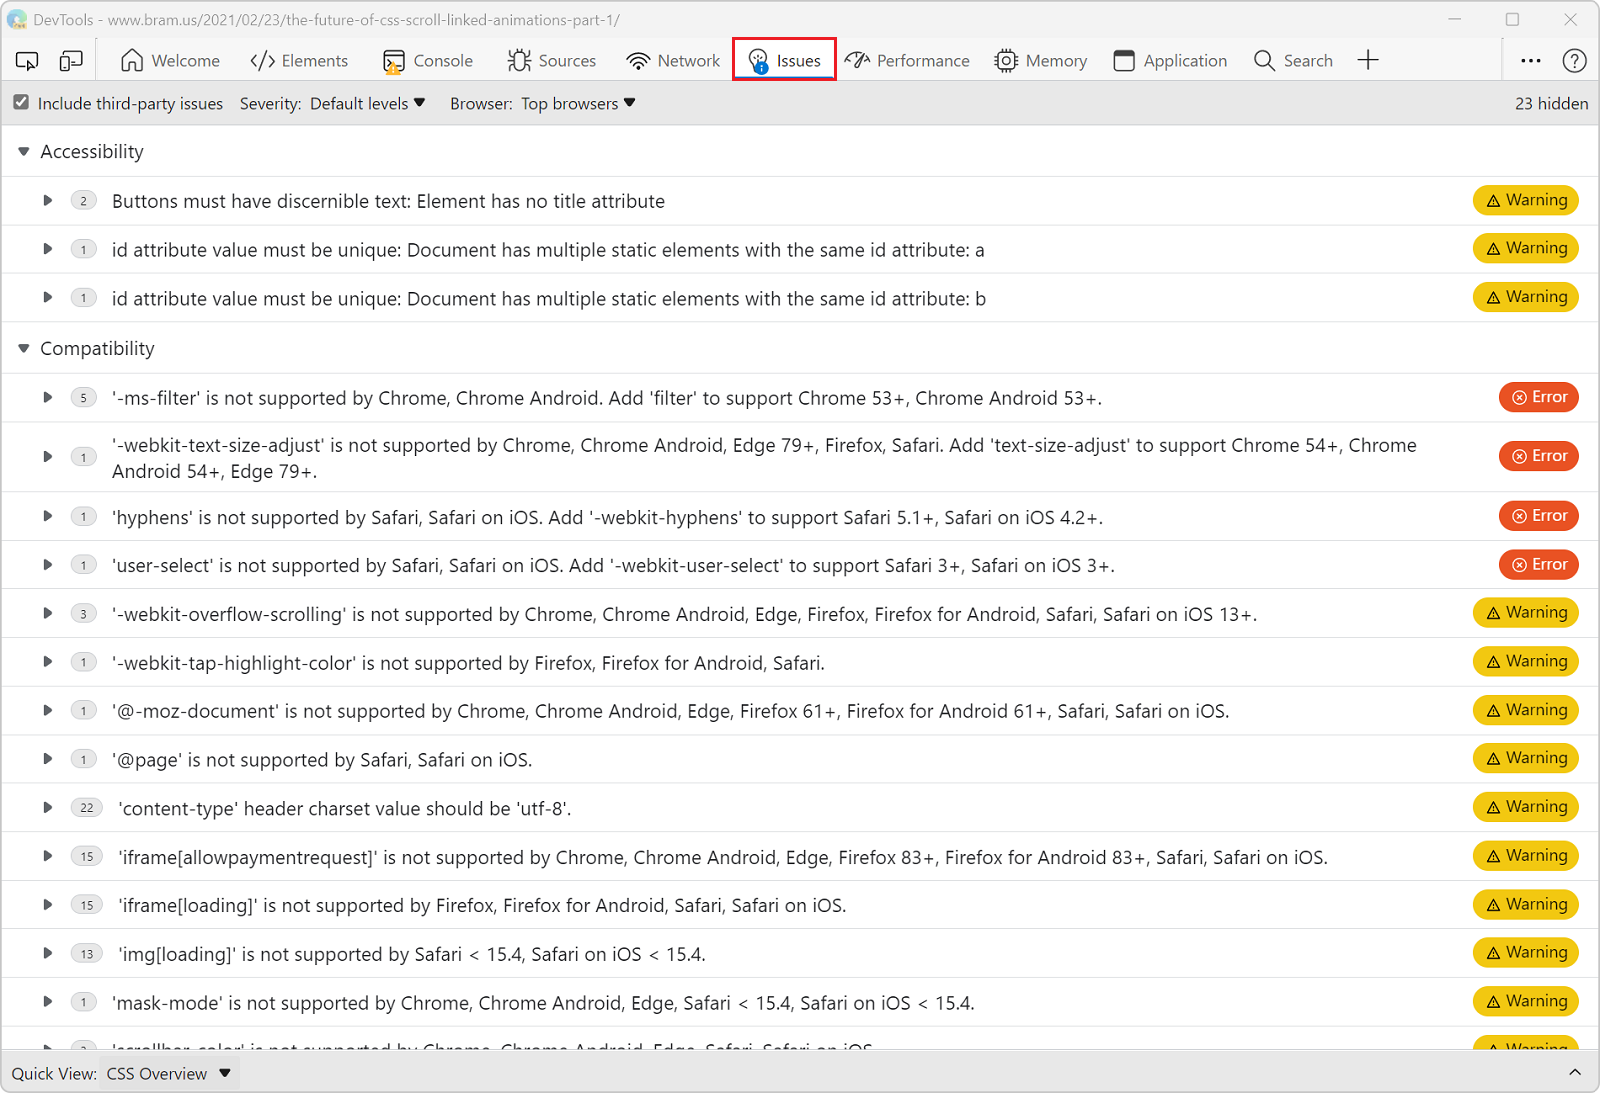 Edge has a very useful Issues panel that can automatically list a lot of different issues with your site. It can detect common issues related to browser compatibility, accessibility, performance, secu... Read moreCategories: Supported by:
 -
Take a screenshot of part of a webpage from the Command Menu
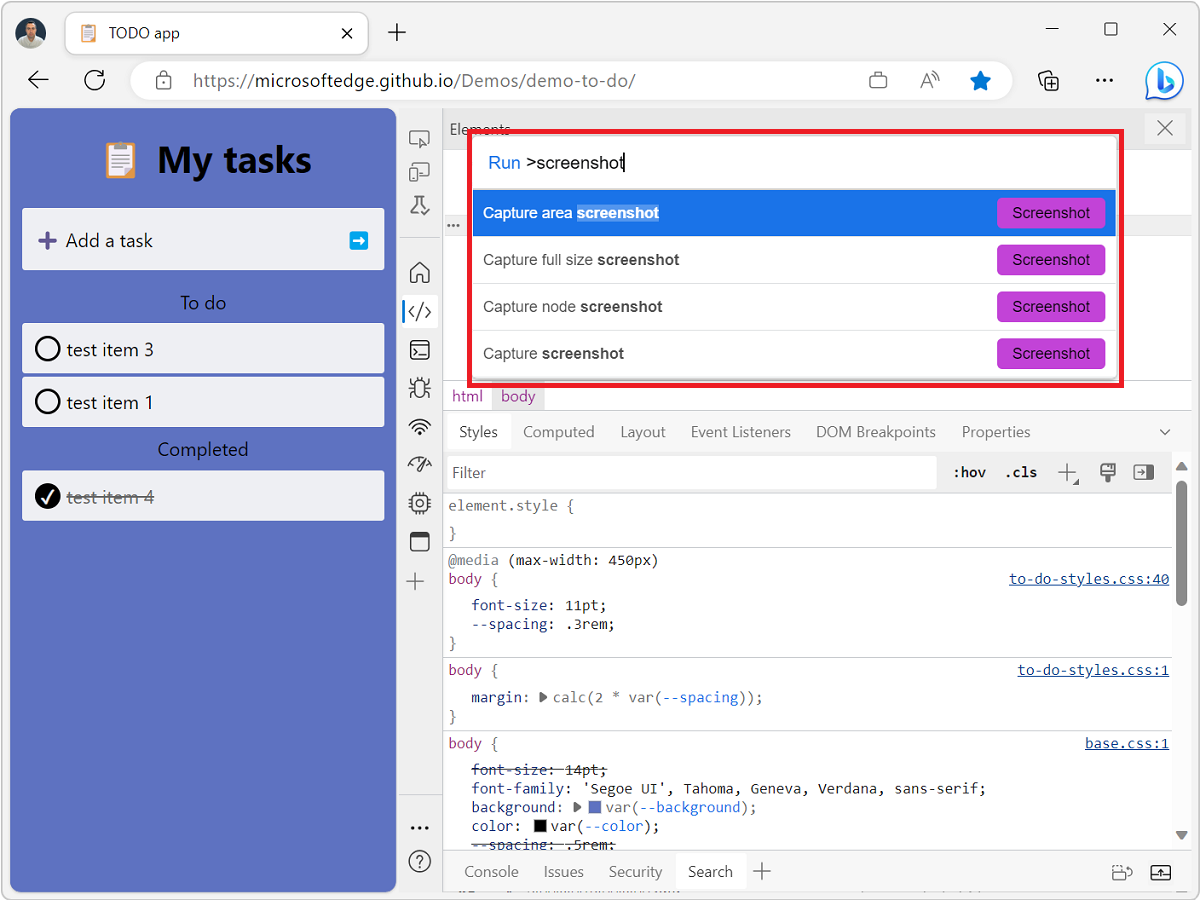 The Command menu in Edge and Chrome is a great way to do many of the things you can do in DevTools without having to navigate the UI. Csaba Kissi shared a great tip on Twitter about the Command menu:... Read more
 -
Quickly reference React components in the console
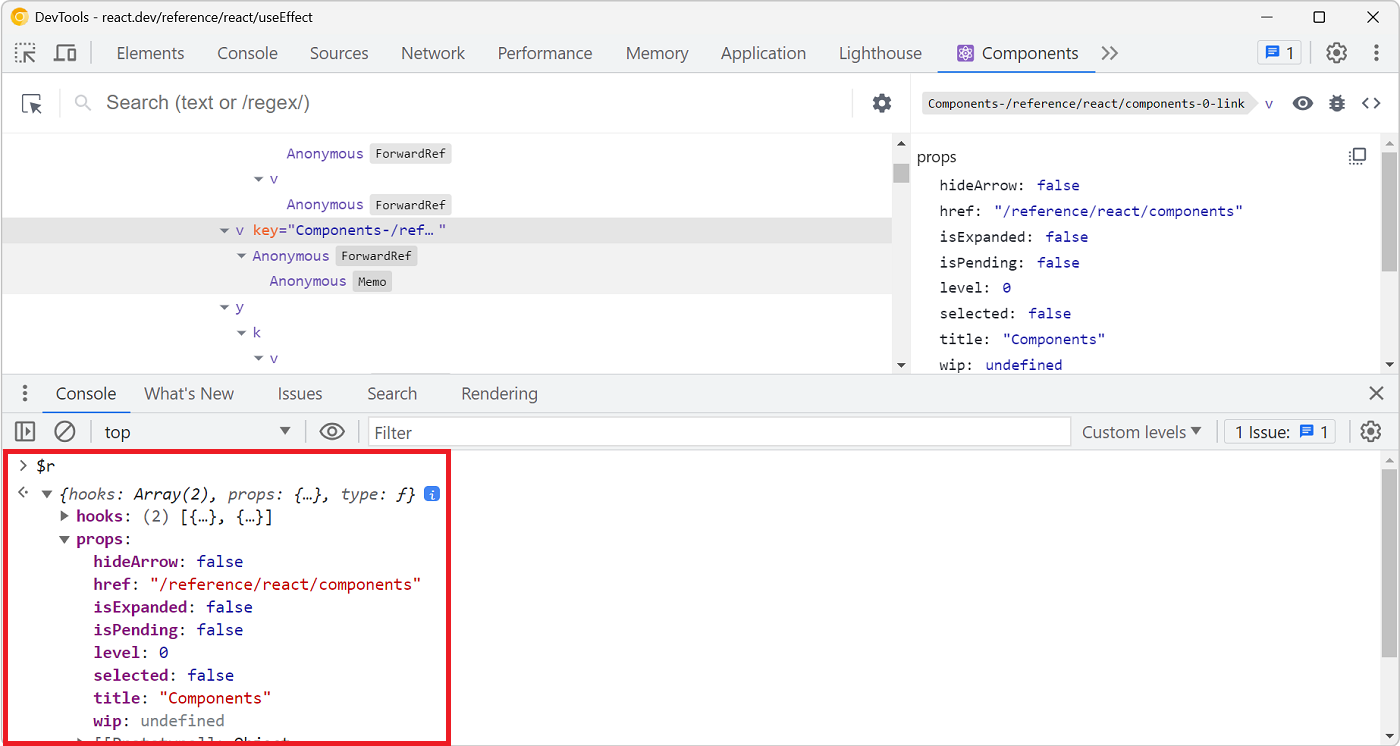 Zee shared a great tip on Twitter if you are working with React and have the React DevTools extension installed. You can use $r in the Console tool to reference the currently selected element in the R... Read more
 -
Start your HTML and CSS prototypes in the browser directly
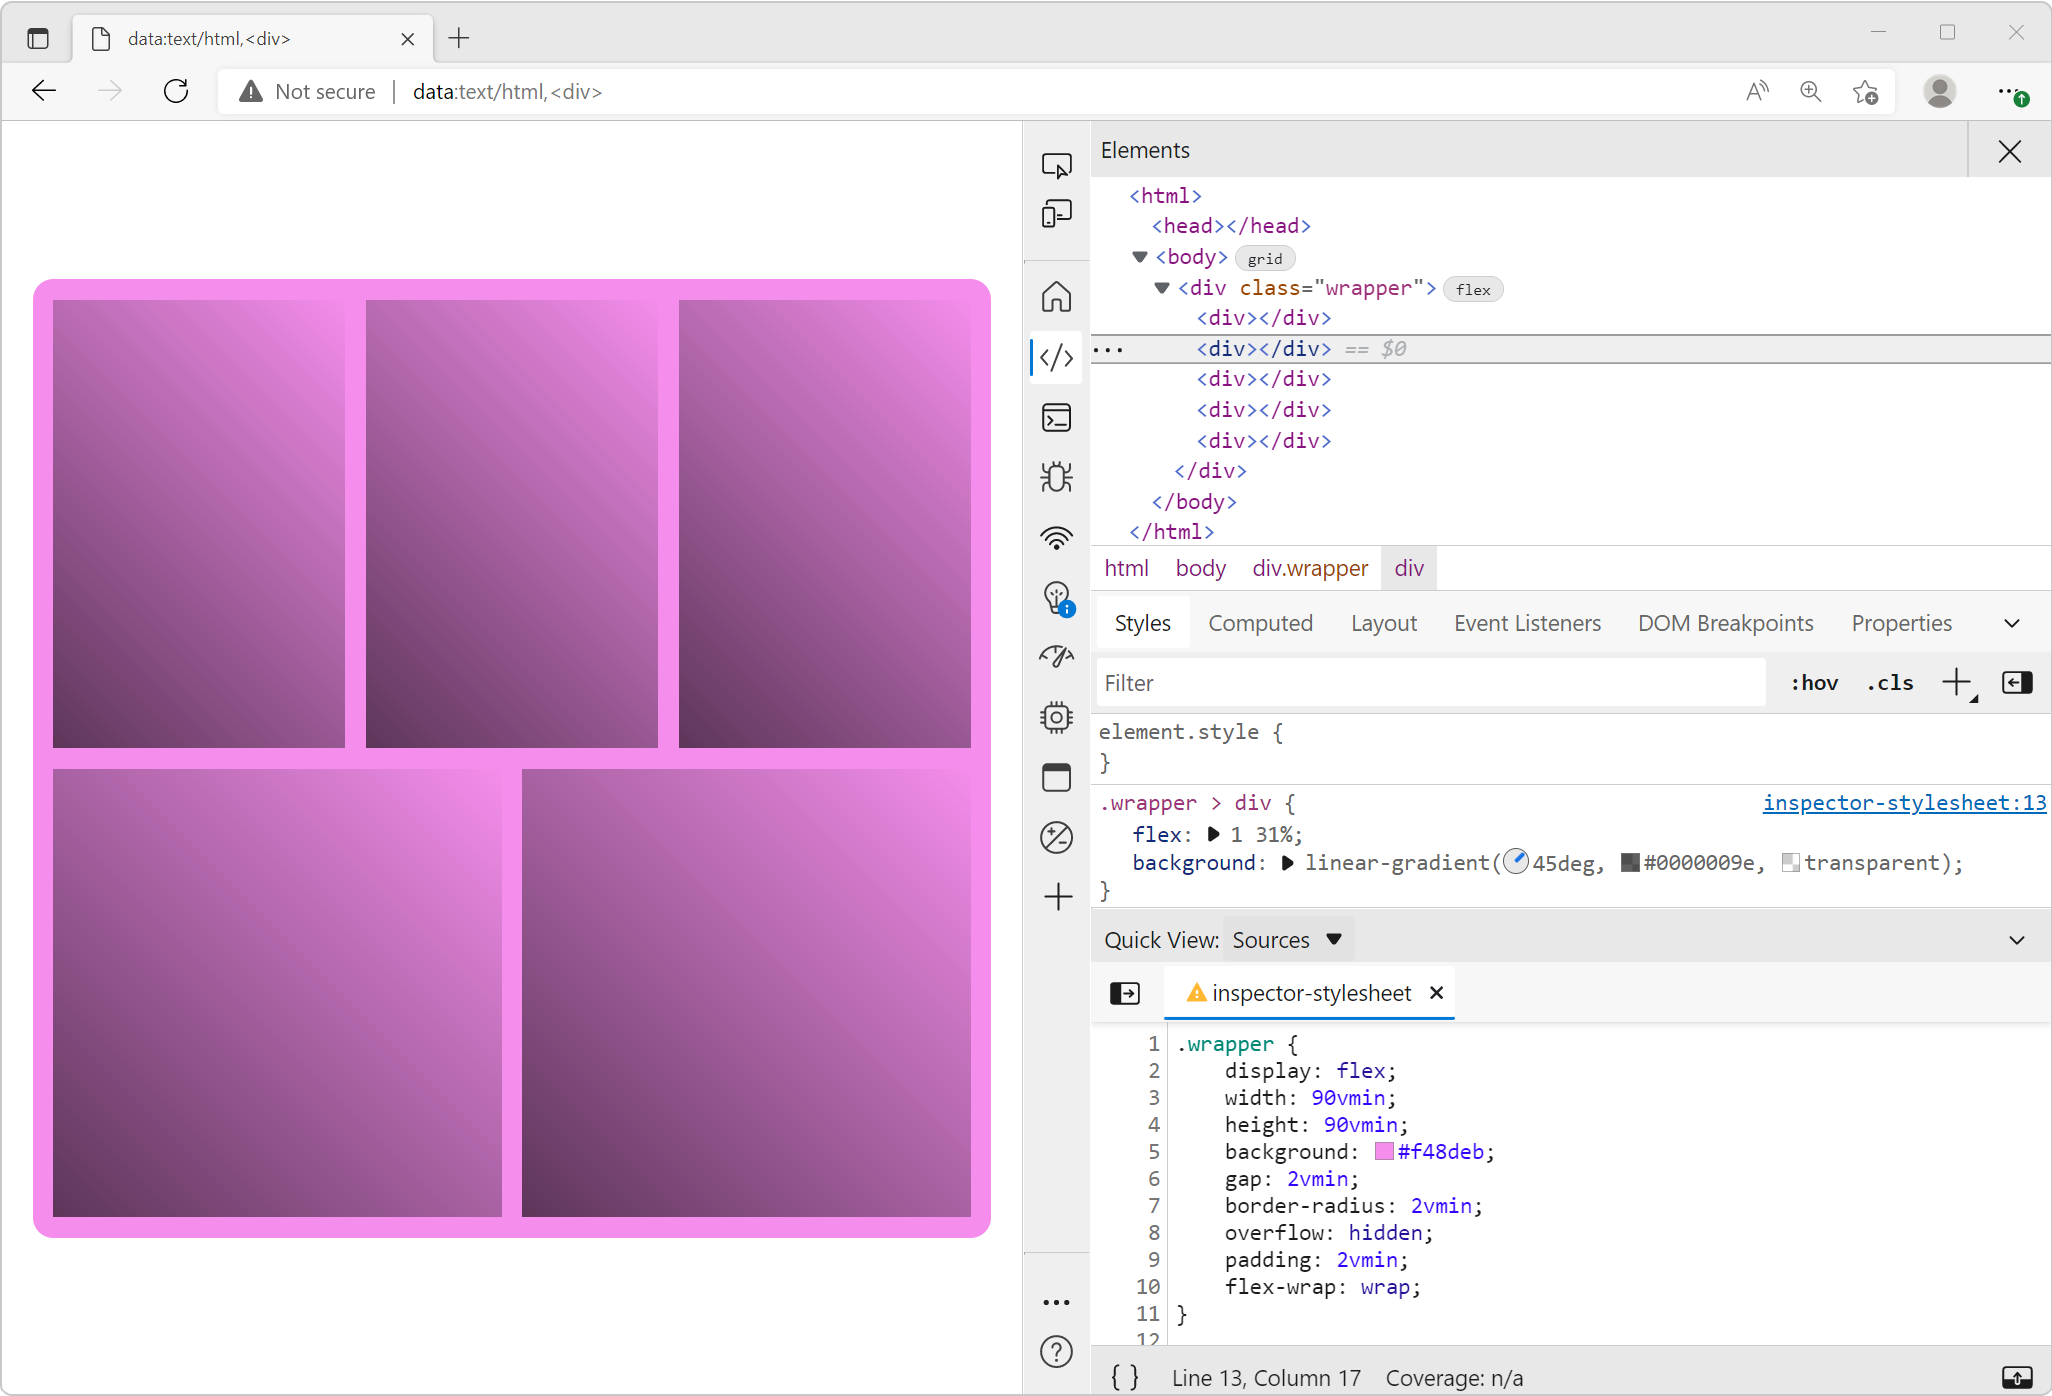 Sometimes I need a blank canvas to prototype an idea with HTML and CSS. Something outside of the website I'm working on. Maybe I need a new layout or component and I'm not sure yet how to do it. In th... Read more
 edge
edge
 chrome
 firefox
 safari
 polypane