184 DevTools Tips
-
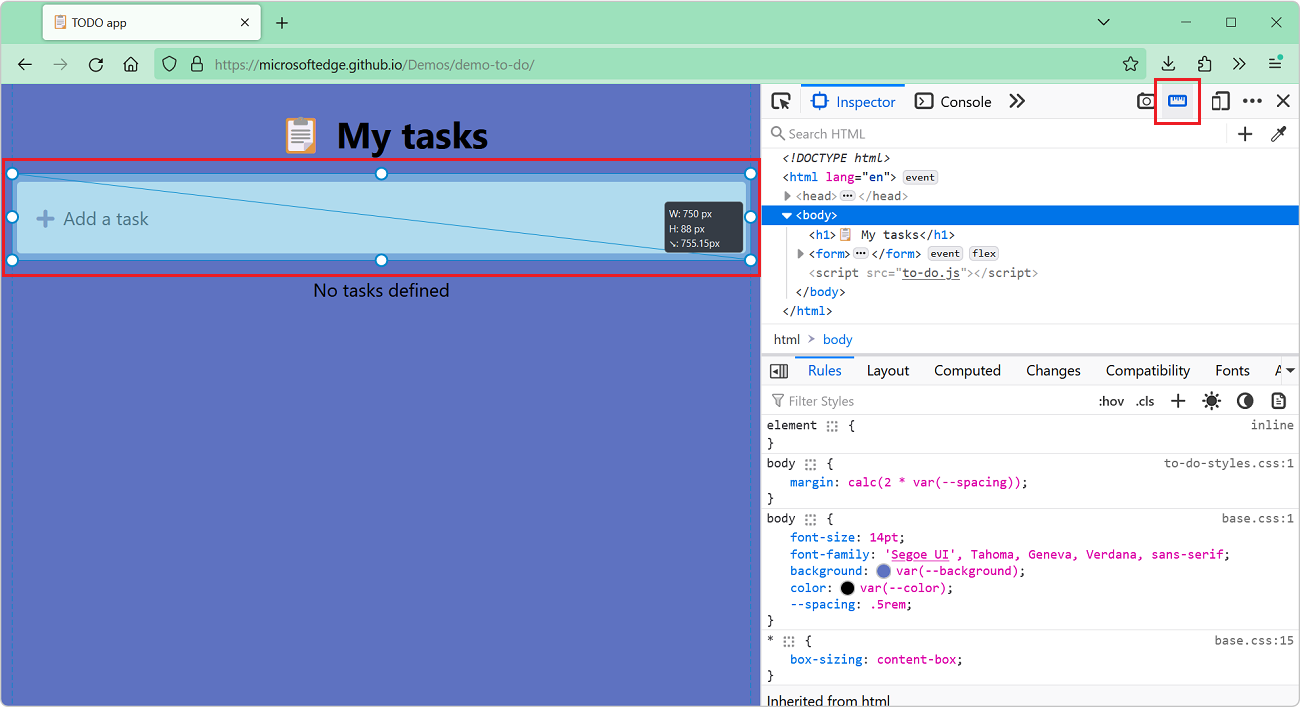
See the viewport size
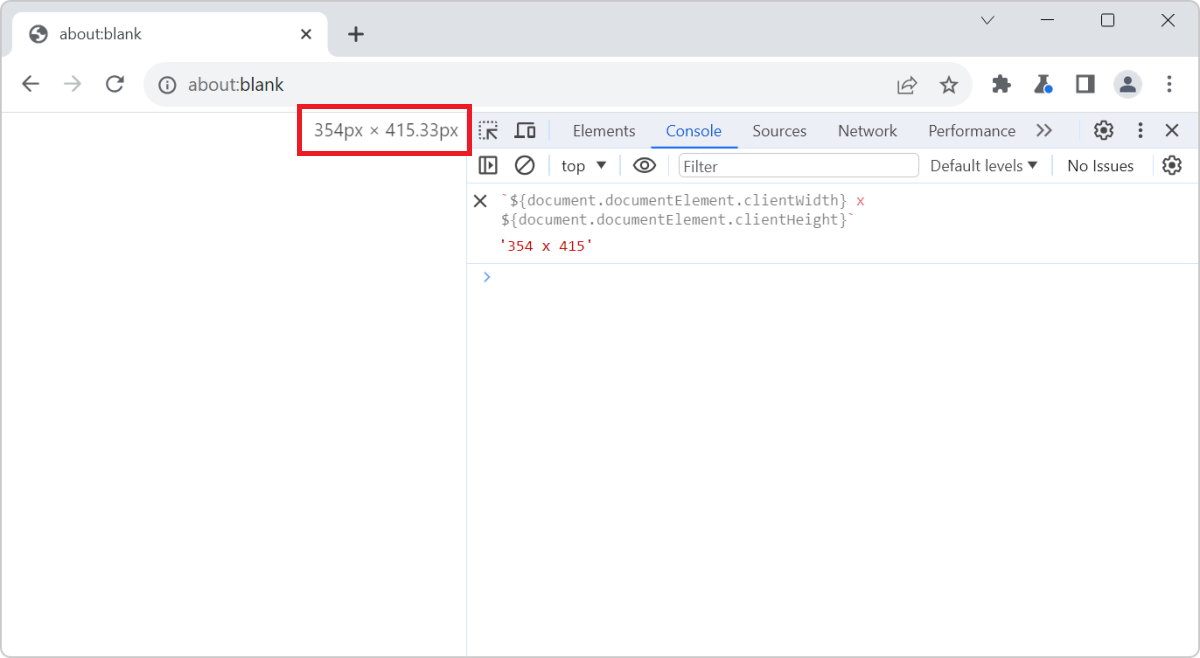 The size of the viewport that's used to render a webpage in a browser can be very important at times, such as when creating or debugging media queries. You can easily know what the current size of the... Read more
 -
Convert images to data-urls
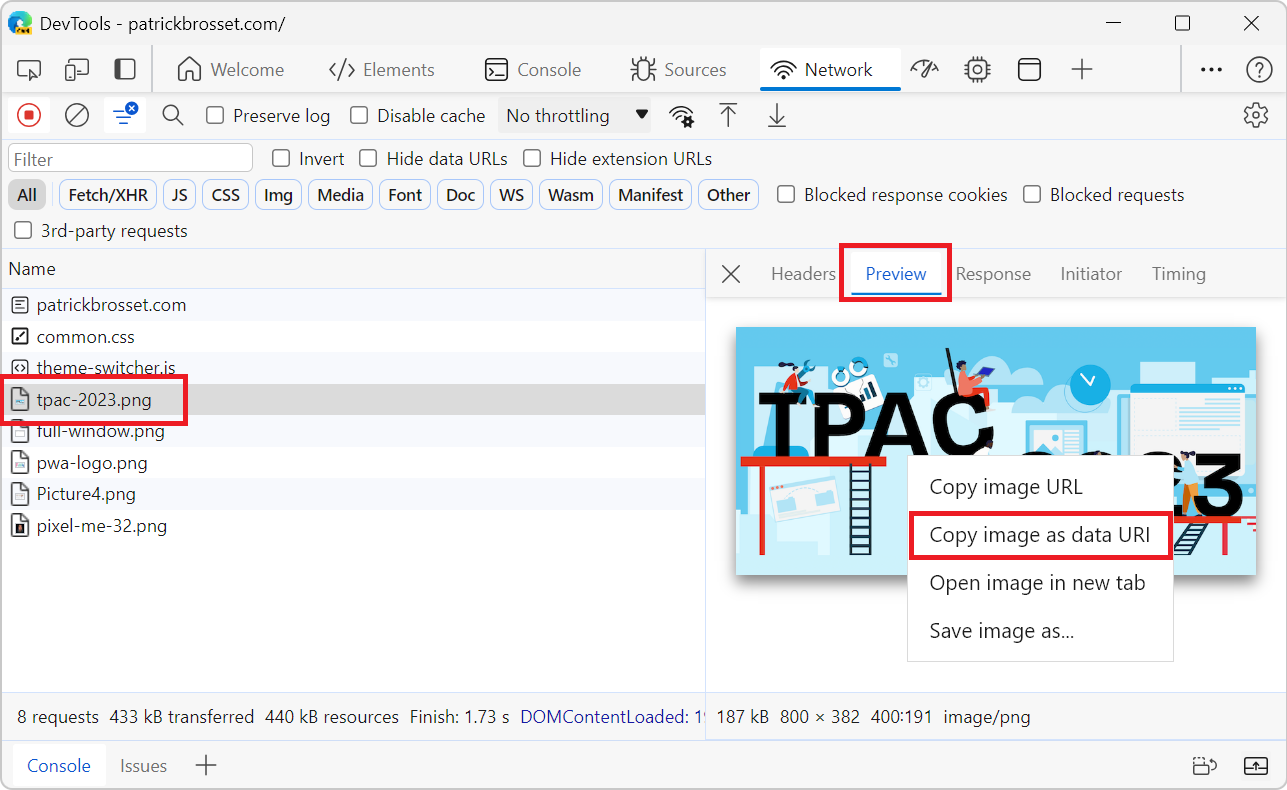 A data URL is a URL that starts with the prefix data: instead of http: or https:. This data prefix (or scheme) allows you to embed the actual content of the resource in the URL itself, rather than lin... Read more
 -
Use user gesture restricted APIs in the Console
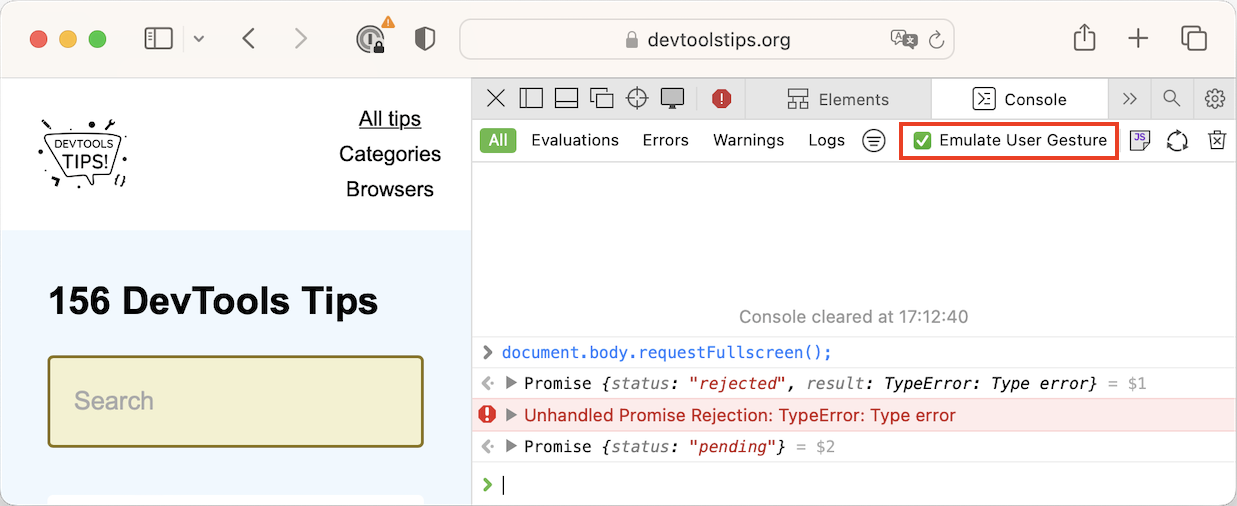 Certain web APIs are user gesture restricted. This means that they can only be called as a result of a user action, such as in a click event handler. For example, you can't simply put yout website in... Read more
 -
Find the offset parent of an element
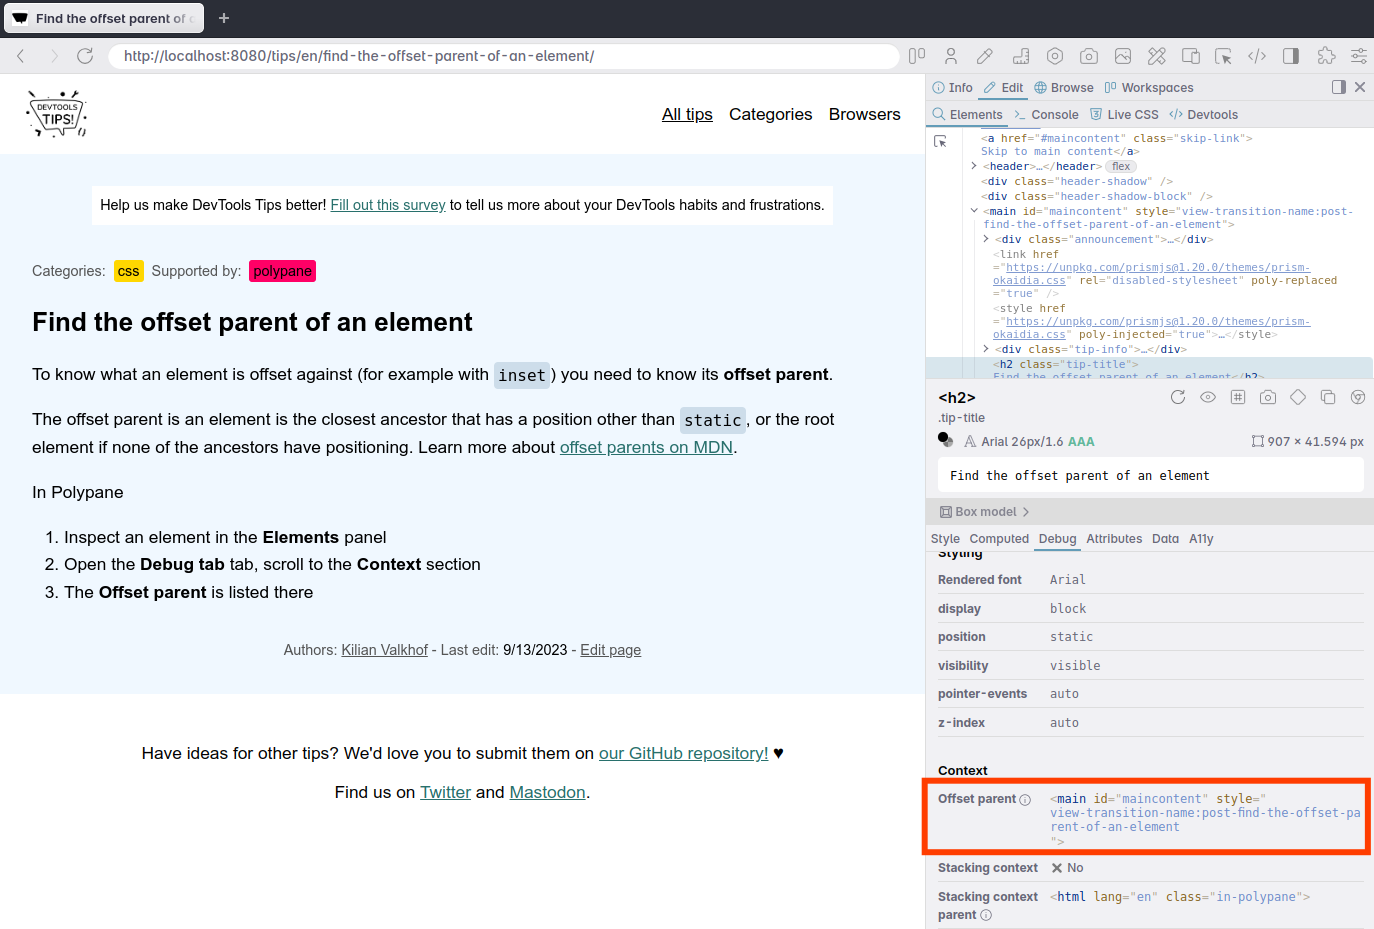 To know what an element is offset against horizontally or vertically (Which you do with position:relative and a left, top or inset value) you need to know its offset parent. The offset parent of an el... Read moreCategories: Supported by:
 -
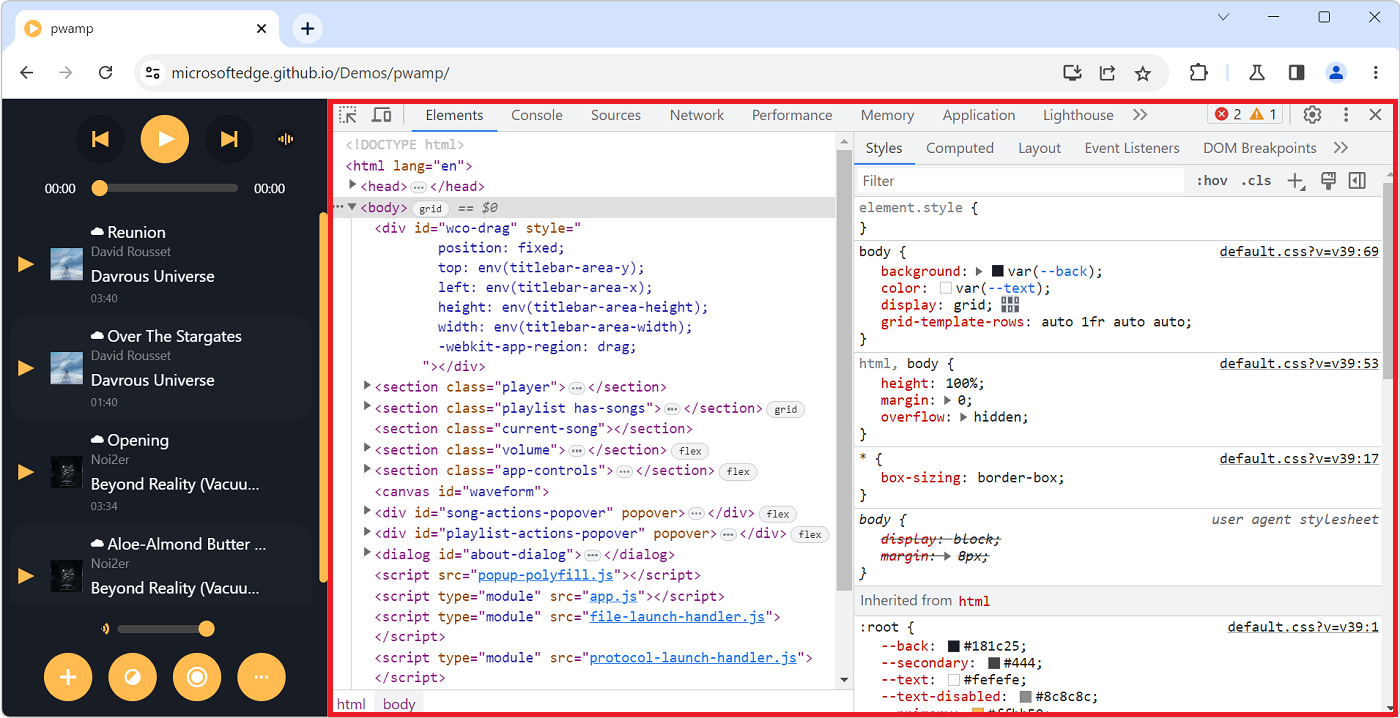
Highlight all elements on the page that match a given CSS selector
 When you select an element in DevTools (in the Elements or Inspector tool), you see the CSS rules that apply to it. But, these rules can also apply to other elements in the page than the currently sel... Read more
 -
Check if a website uses third-party cookies
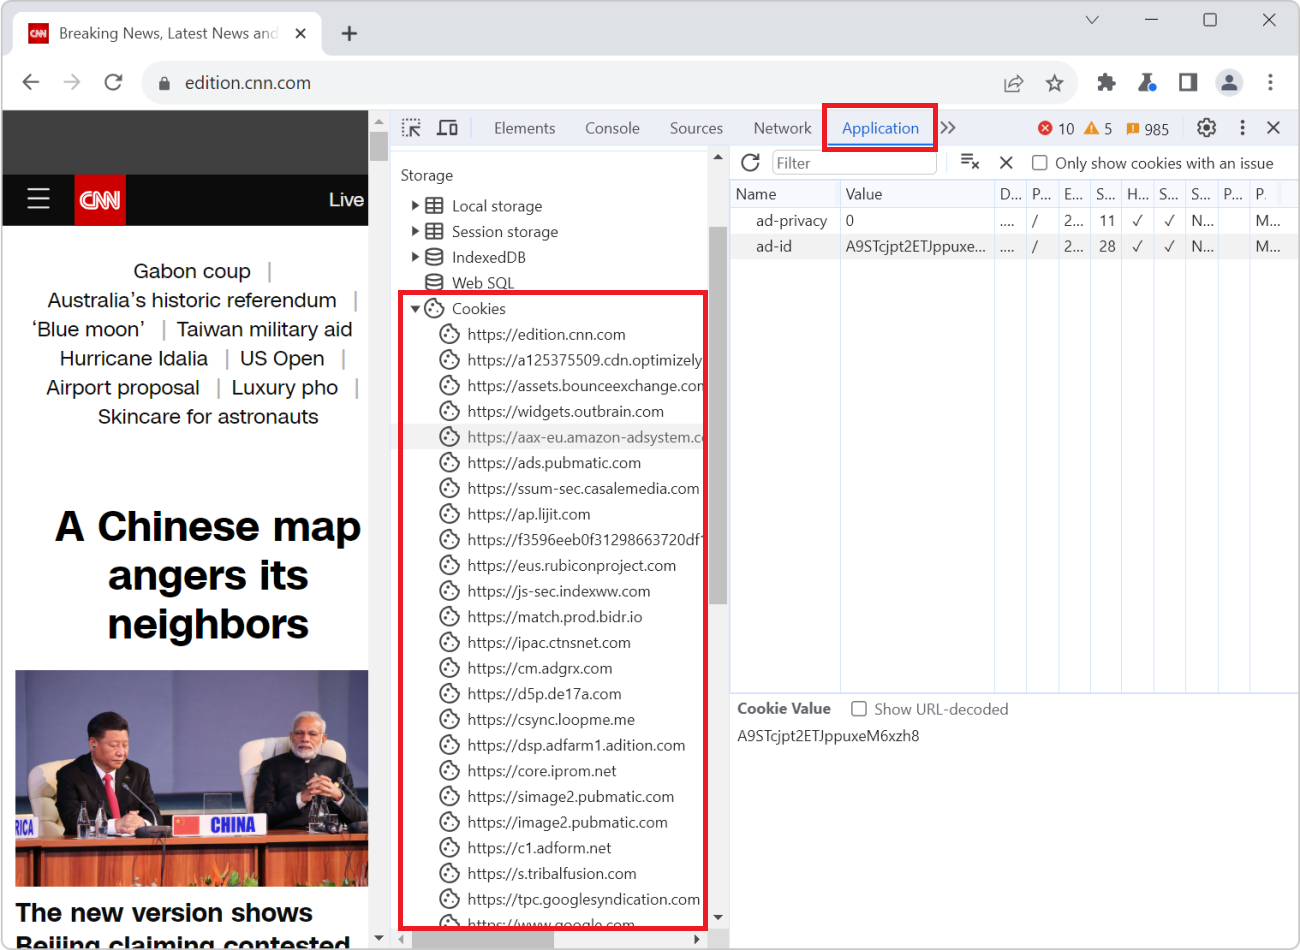 Cookies are small files that websites save on your computer when you visit them. Websites often use cookies to remember things about your last visit. For example, a weather website can use cookies to... Read more
 -
Customize the way objects look in DevTools
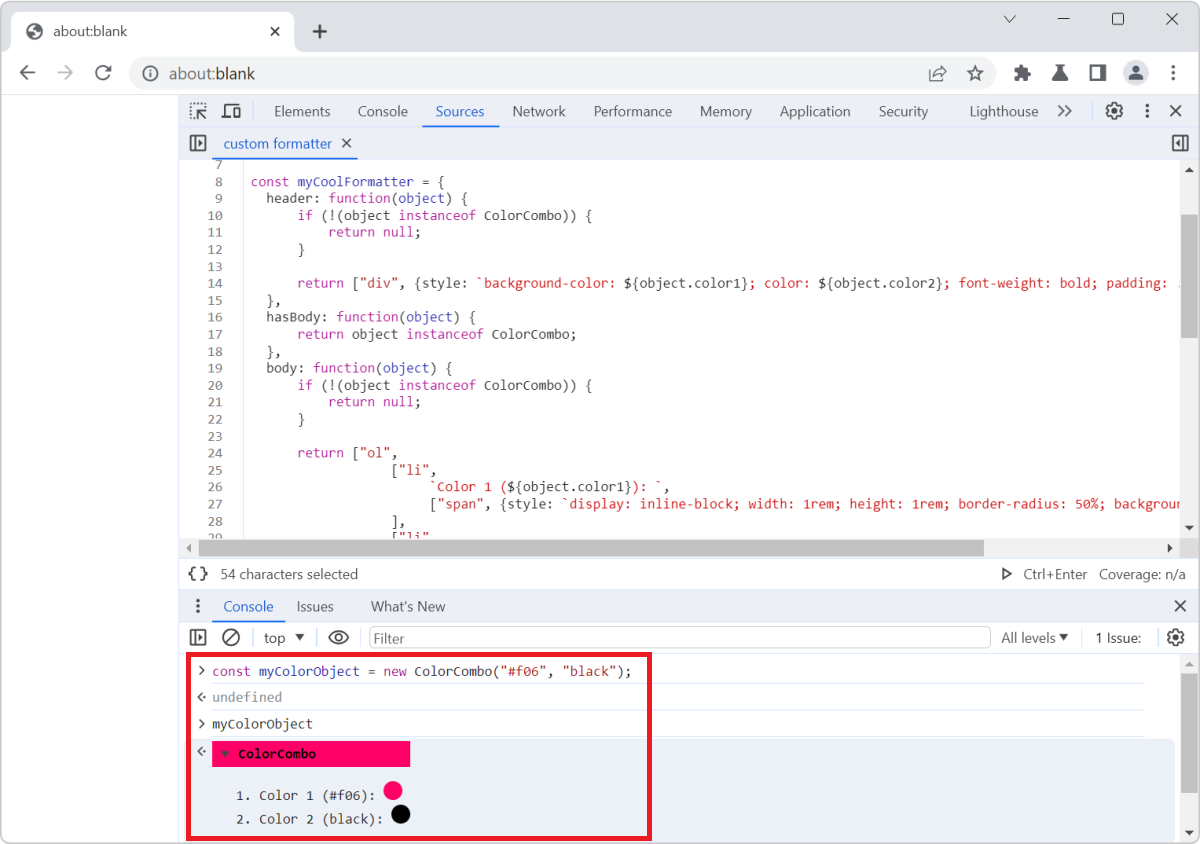 Objects appear in many places in DevTools. Most commonly in the Console tool, but also in various parts of the Sources (or Debugger) tool when you debug JavaScript code. DevTools is the one that decid... Read more
 -
Inspect DevTools with DevTools
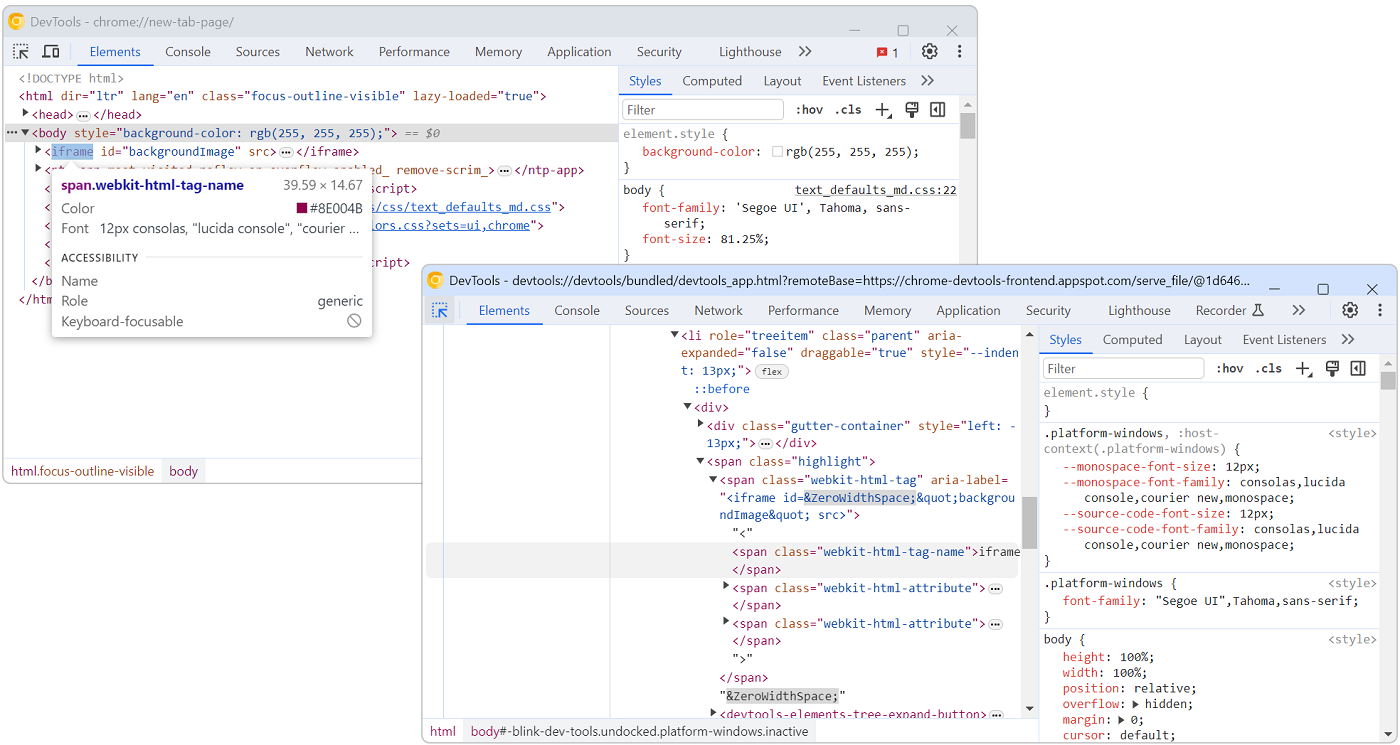 The user interface of DevTools is built with HTML, CSS, and JavaScript. This means you can inspect and debug DevTools with DevTools. Chromium # To debug DevTools in Chromium-based browsers, such as Ch... Read more
 -
Create your own DevTools theme
 You can change the color theme of DevTools to match your preference (see Change the color theme of DevTools to learn more), but you can also create your own theme from scratch by creating a browser ex... Read more
 -
Find memory leaks by comparing heap snapshots
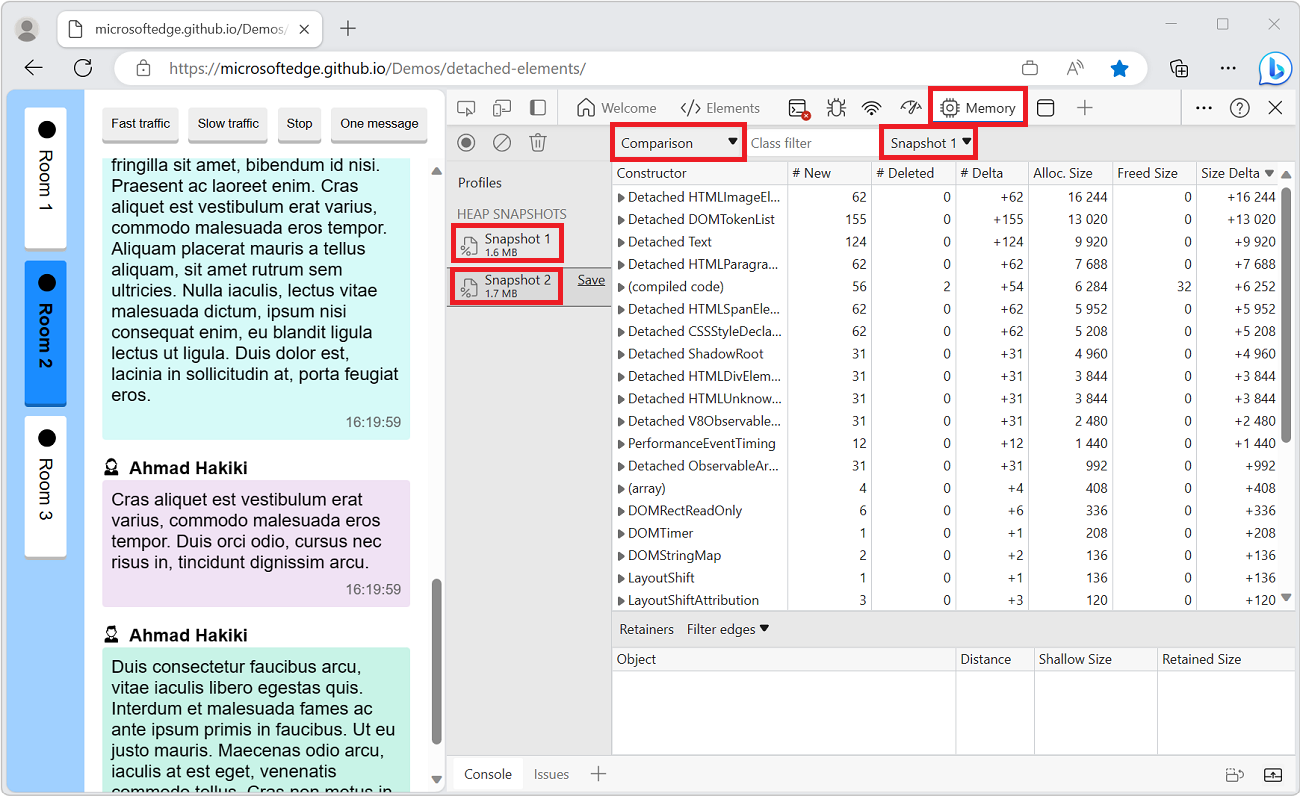 Note: If you think your memory leak comes from DOM nodes, you can also use the Detached Elements tool in Edge, see Get detached DOM elements to investigate memory leaks. Memory leaks are hard to find... Read more
 -
Add custom headers to the network table
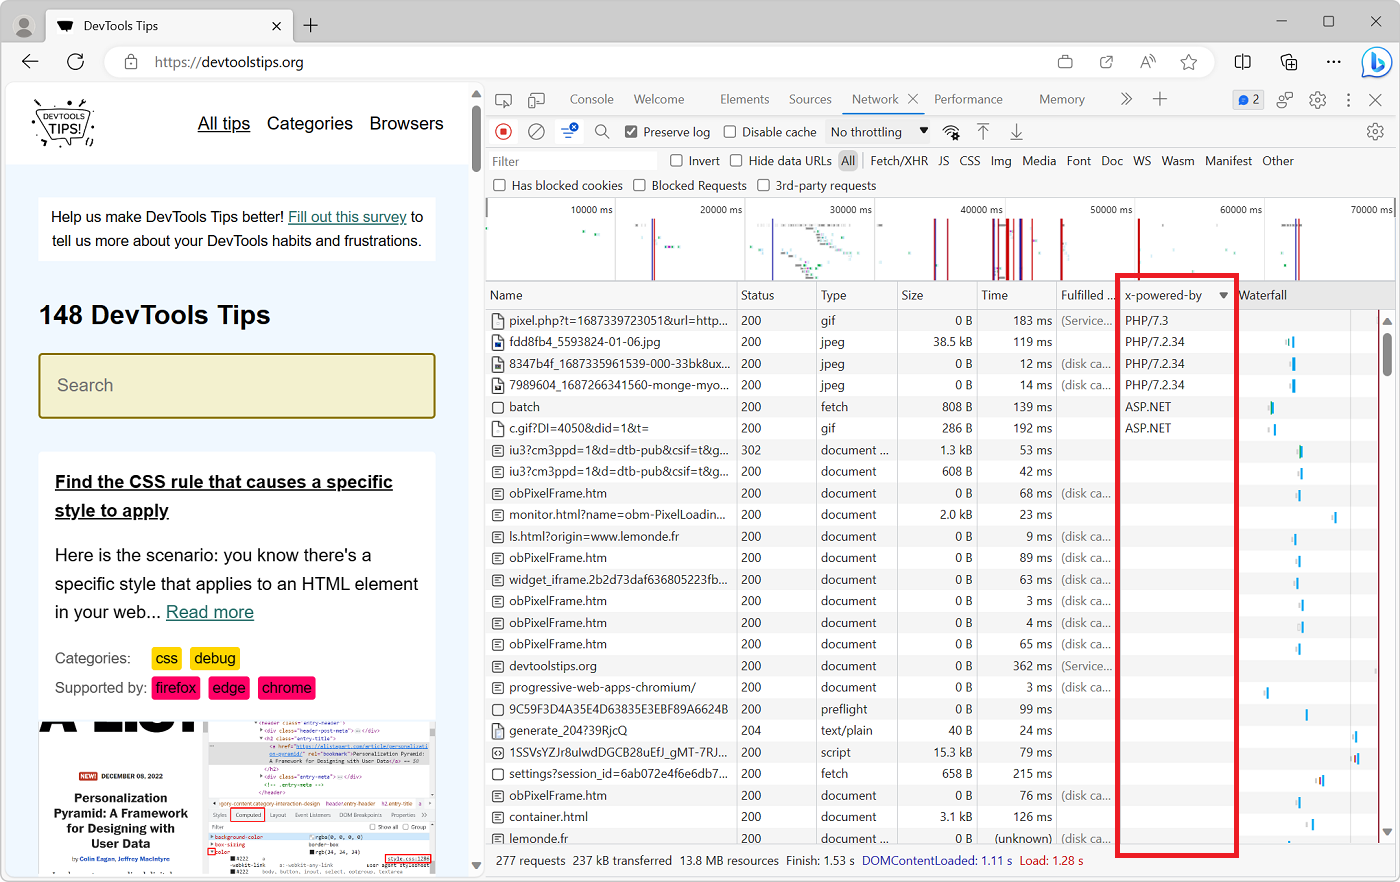 On the web, when a client (a browser) and a server communicate using HTTP, the requests and responses they send to each other contain headers. These headers are key/value pairs that contain metadata a... Read more
 -
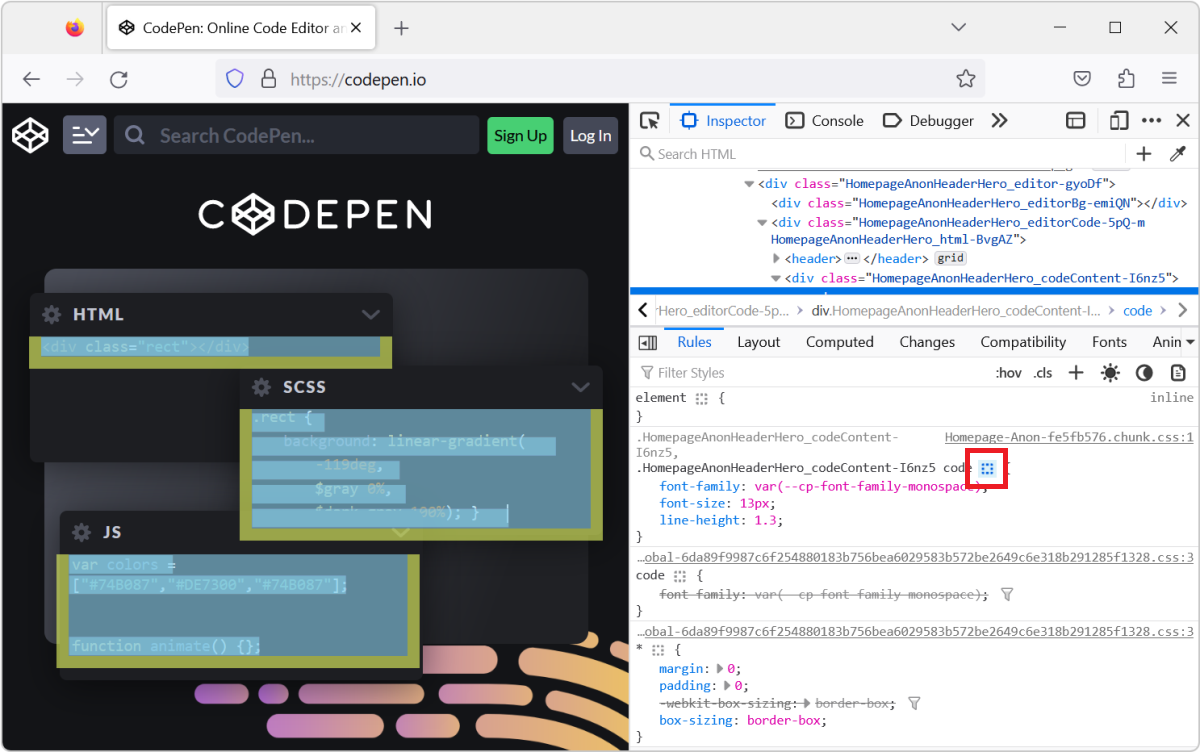
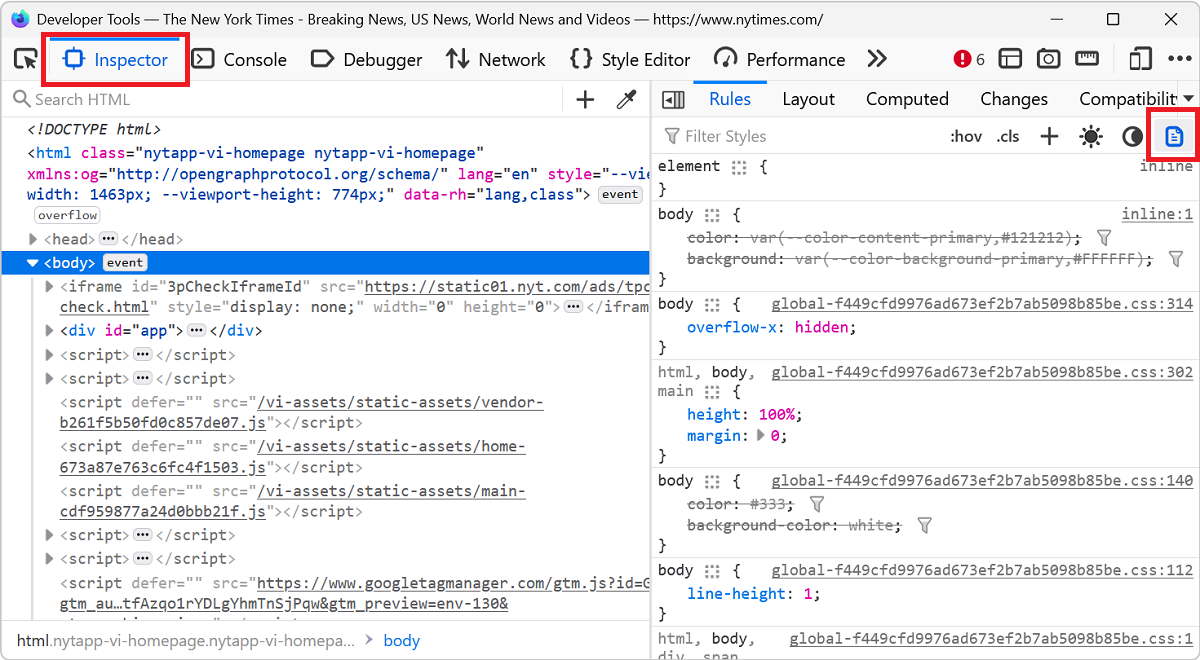
Find the CSS rule that causes a specific style to apply
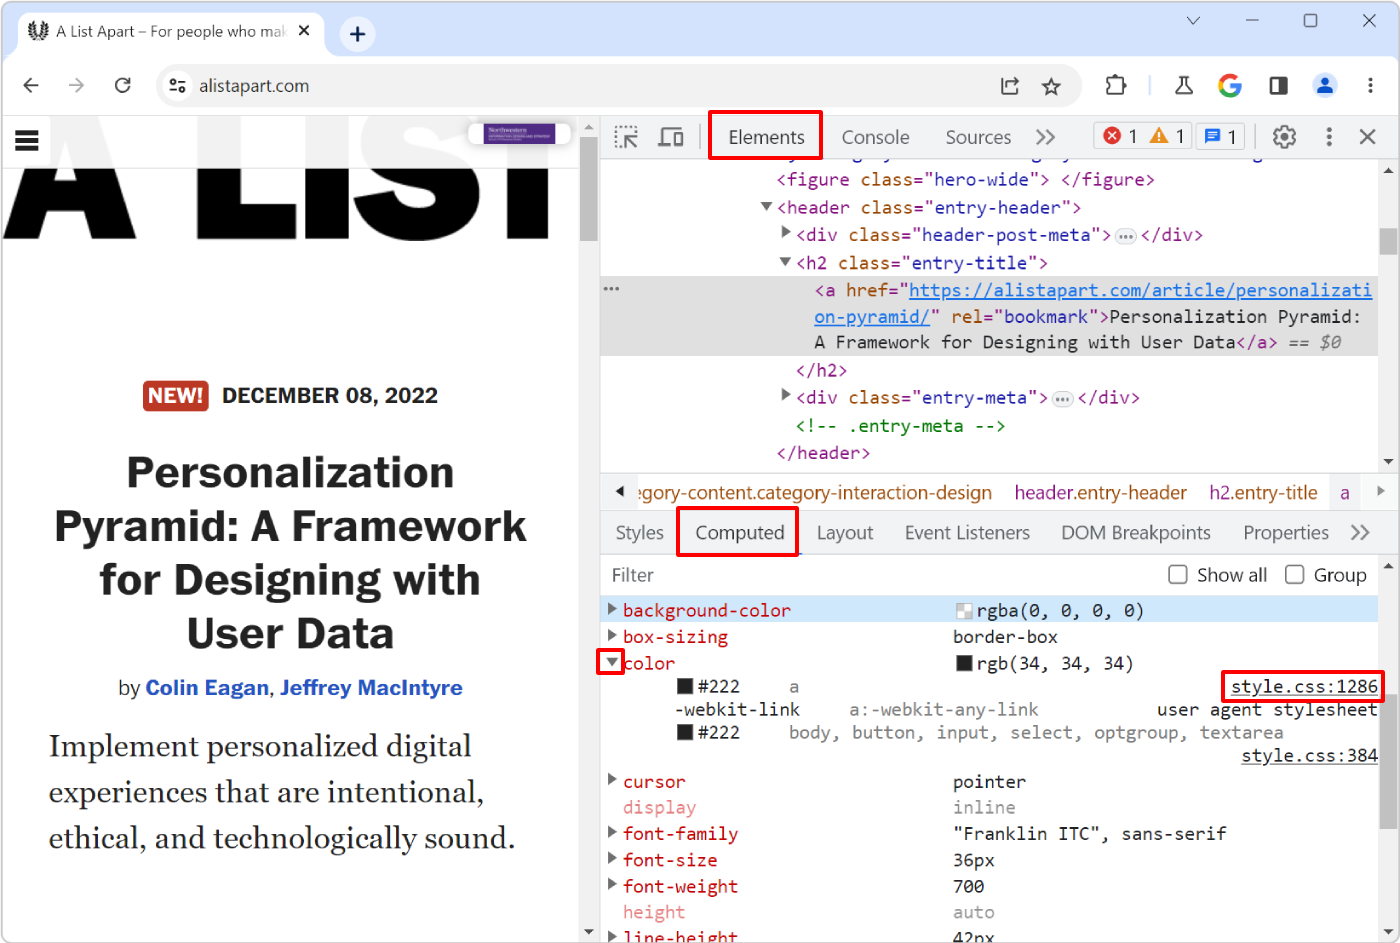 Here is the scenario: you know there's a specific style that applies to an HTML element in your web page, say some padding, but you can't seem to find where, in the CSS code, that style is coming from... Read more
 -
Debug your Safari Web Apps on macOS
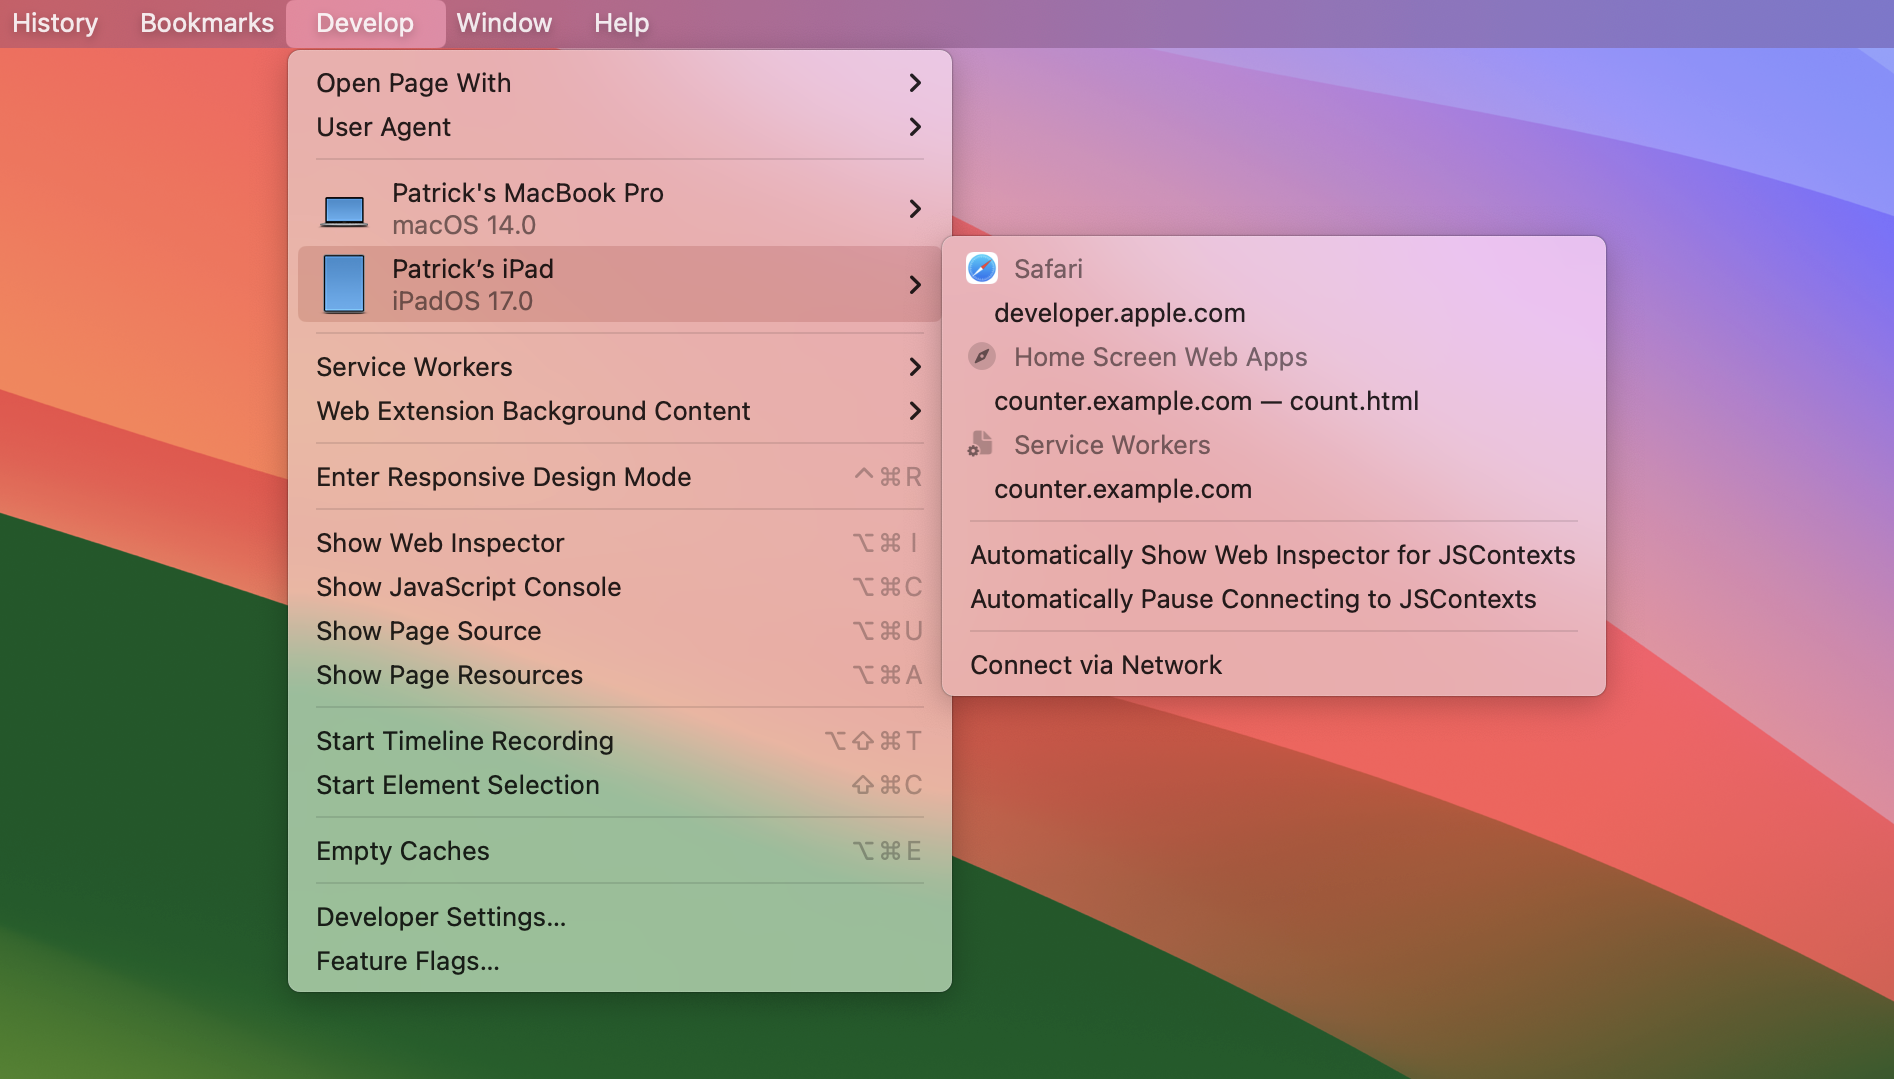 Starting with Safari 17 (announced at WWDC 2023) any website you use in Safari can be installed as a Web App on macOS. Once installed, the Web App shows up like any other app on macOS, in all of the s... Read moreCategories: Supported by:
 -
Understand when the Console opens in the main panel and in the drawer
 Have you noticed how the Console tool is sometimes displayed in a top-level tab (just like all other tools), and sometimes in a split pane at the bottom, below the main tool? If you've been confused b... Read more
 -
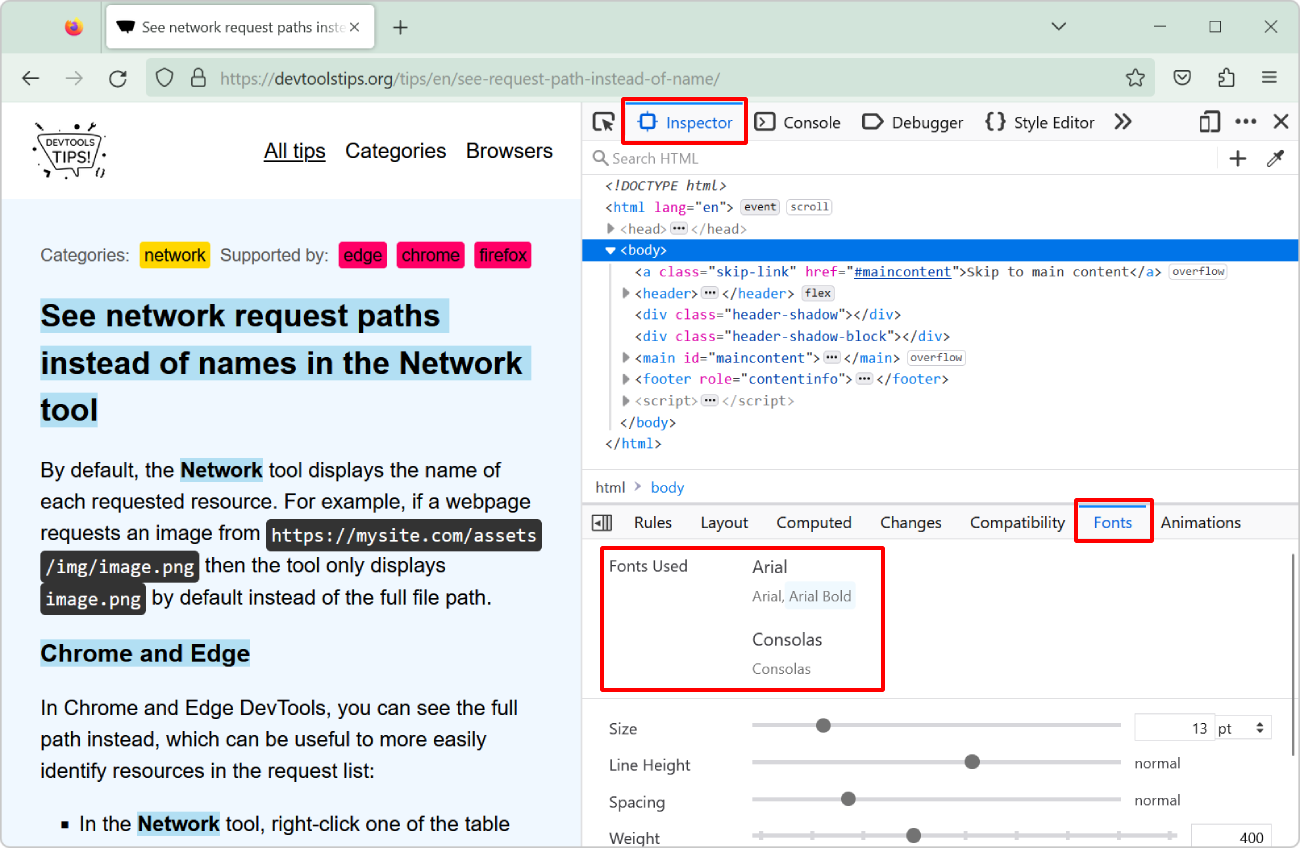
Know which of the font in a font-family was actually used
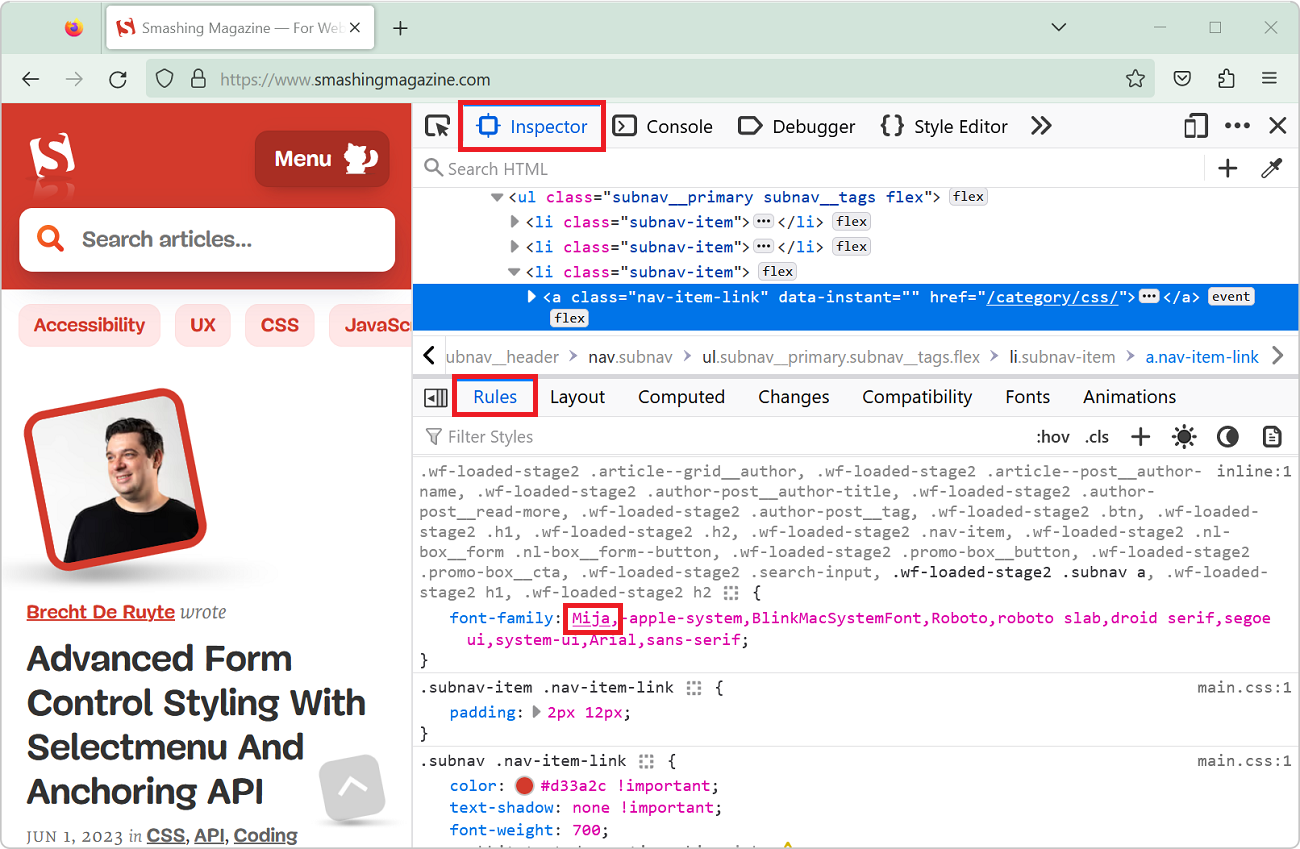 The CSS font-family property let's you define a comma-separated list of fonts that the browser engine should choose from (in priority order) to render text. For example, with font-family: "Gill S... Read moreCategories: Supported by:
 -
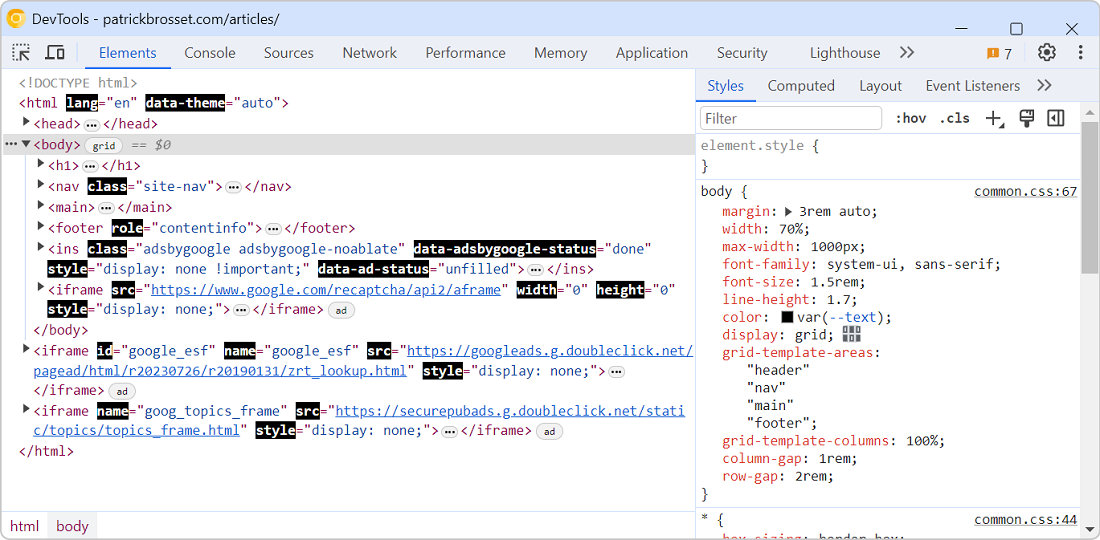
Find all elements with a specific style
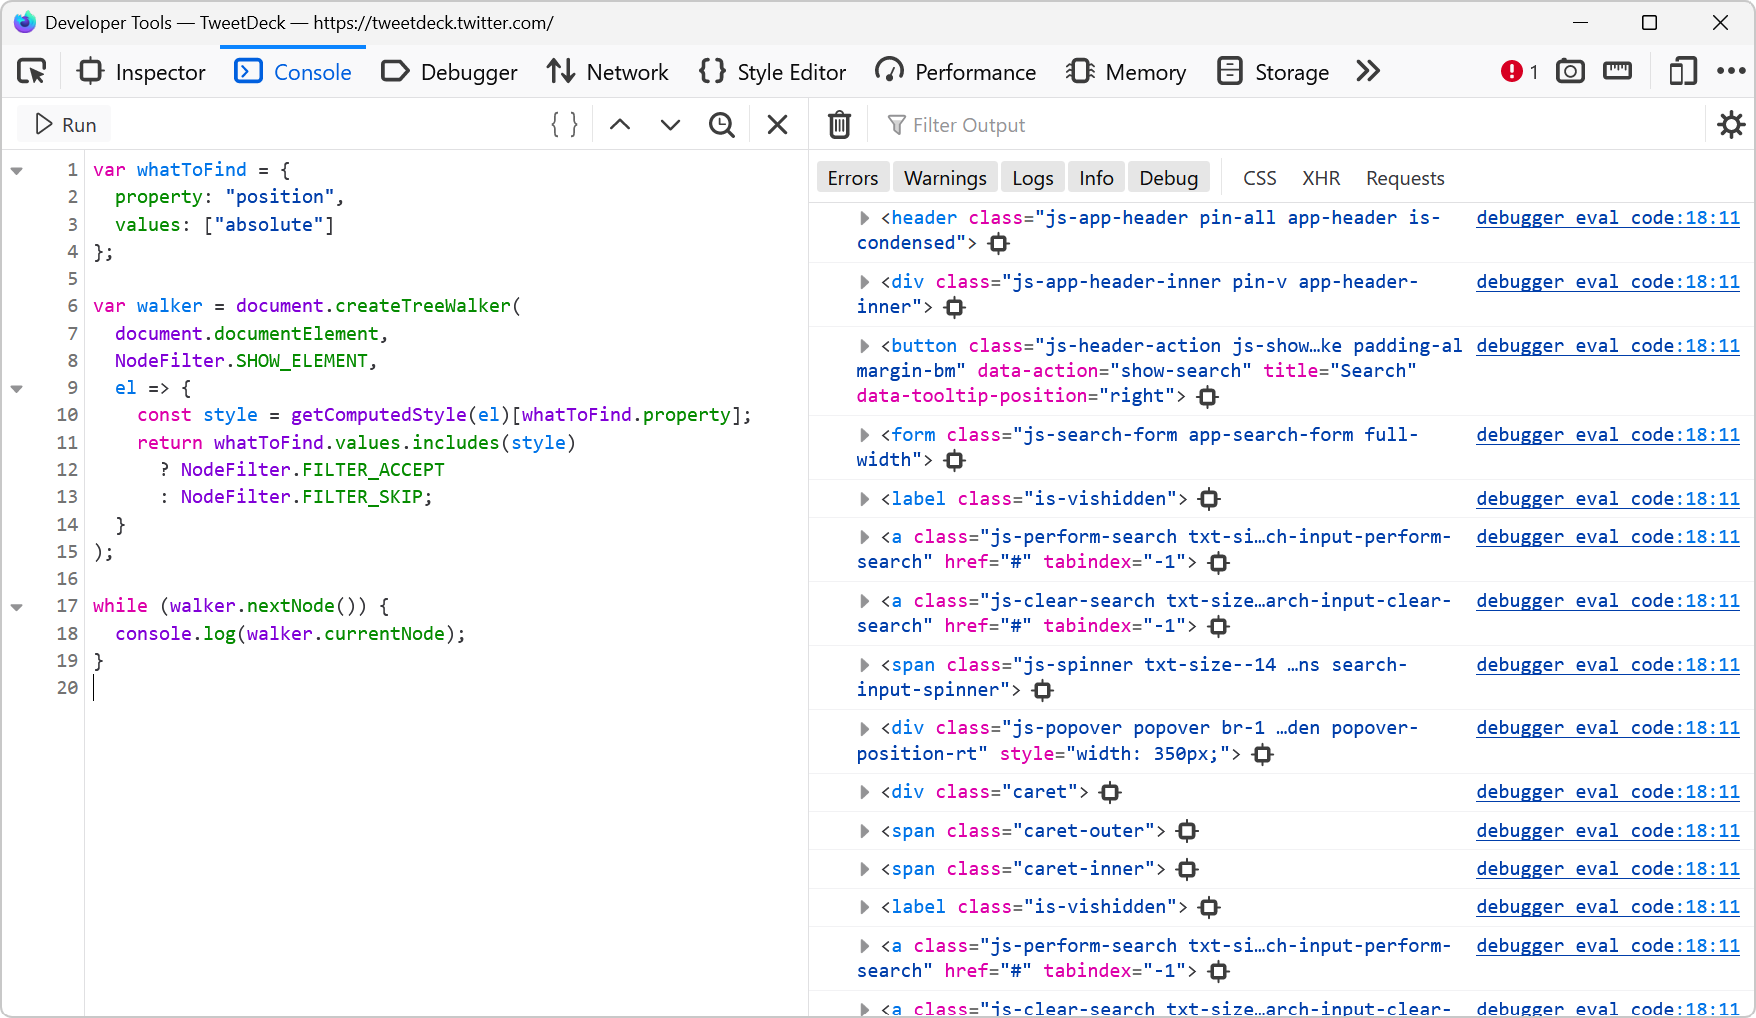 Let's say you want to list all of the elements on a page that are absolutely positioned. Or maybe you want to find all of the elements that use CSS grid. How would you do that? One way is to run a few... Read more
 -
Inspect and debug iframes
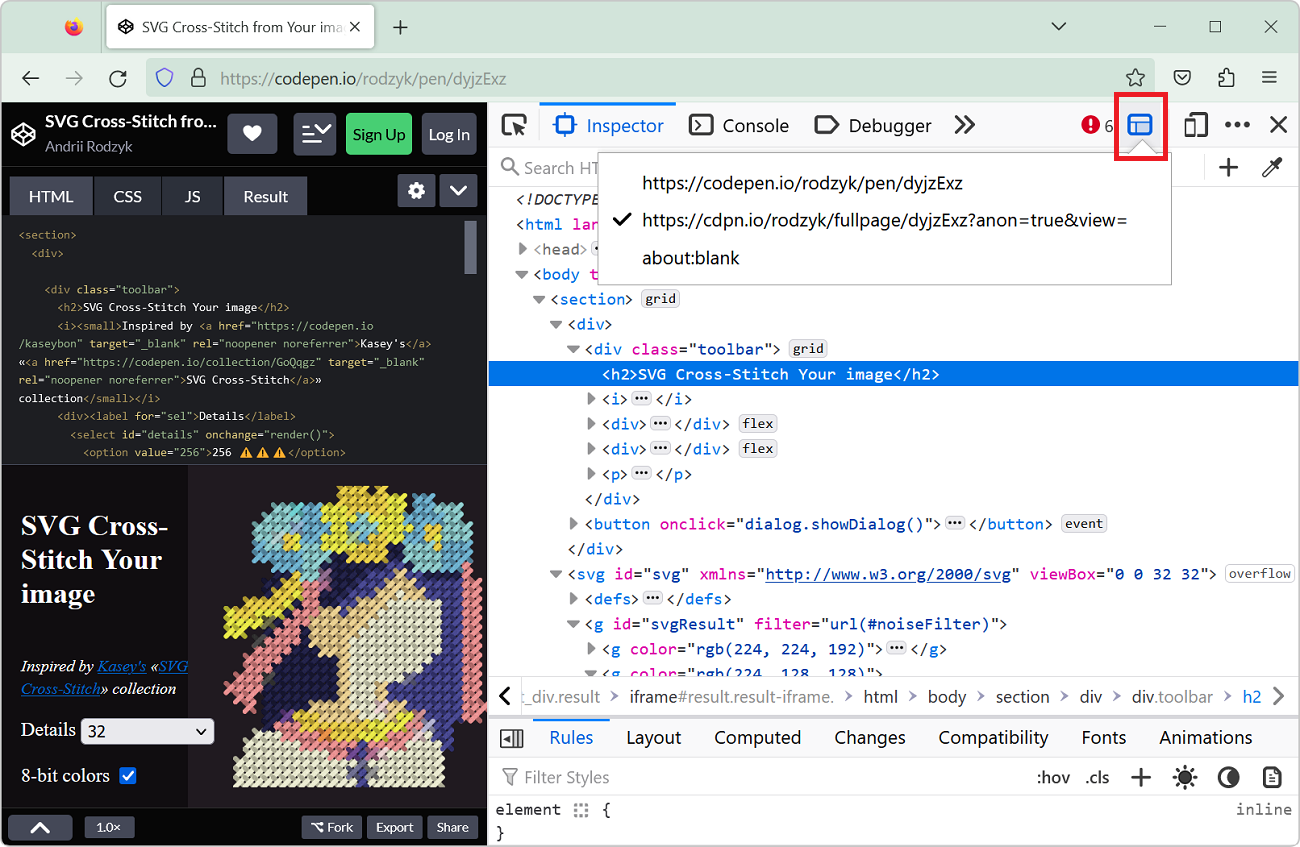 If the page you are working on contains an iframe which you want to inspect and debug, you can actually use DevTools to do so. This can be very useful when working with coding playground sites like Co... Read more
 -
Take high-resolution screenshots of web pages
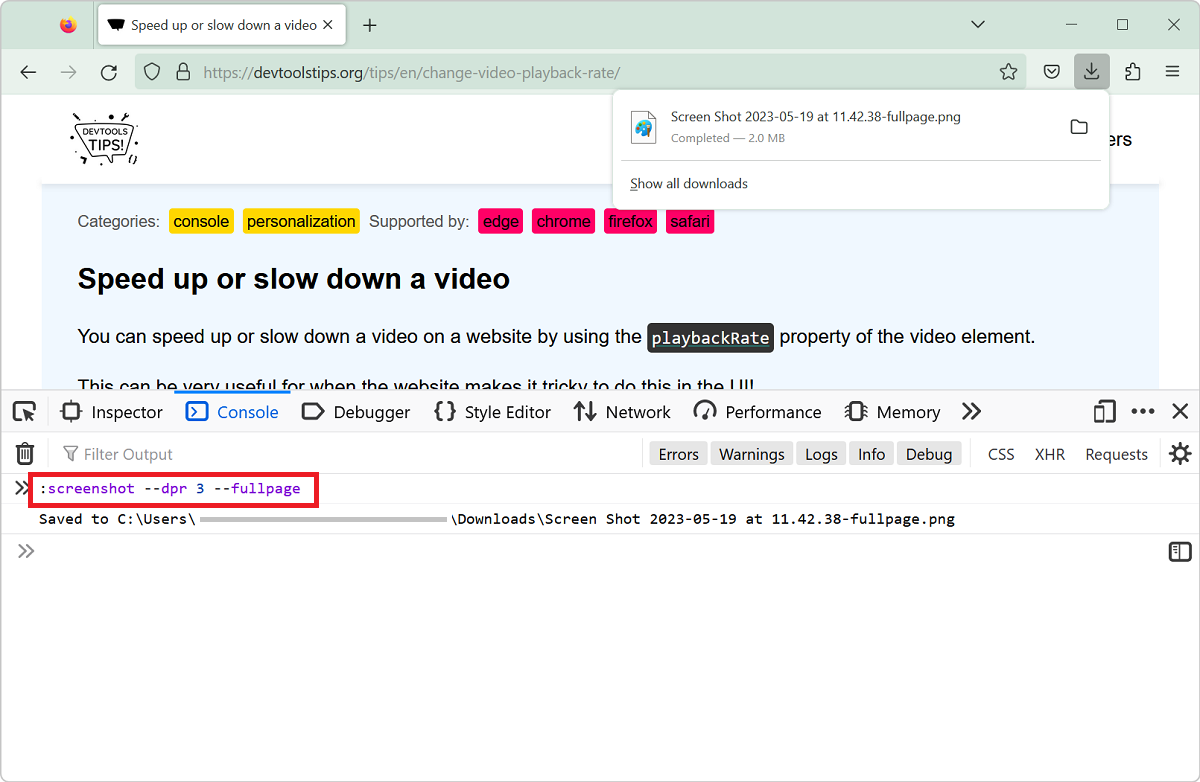 Taking screenshots of all or parts of web pages is super useful (scroll down to the See Also part at the bottom of this page for more tips on that). But sometimes, the resulting screenshots aren't hig... Read more
 -
Customize the columns shown in console.table
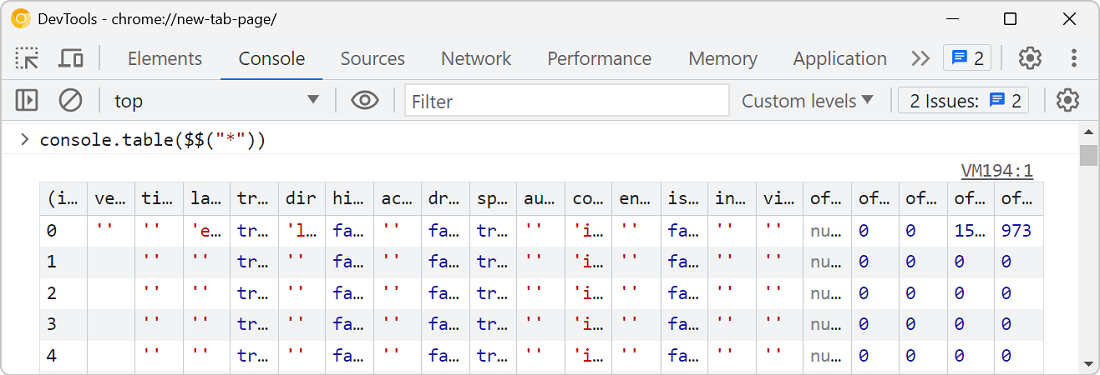 The console.table method is great for displaying tabular data in the console, but what if the objects your're logging contain a lot of properties, causing a lot of columns to appear in the console? Fo... Read more
 -
Speed up or slow down a video
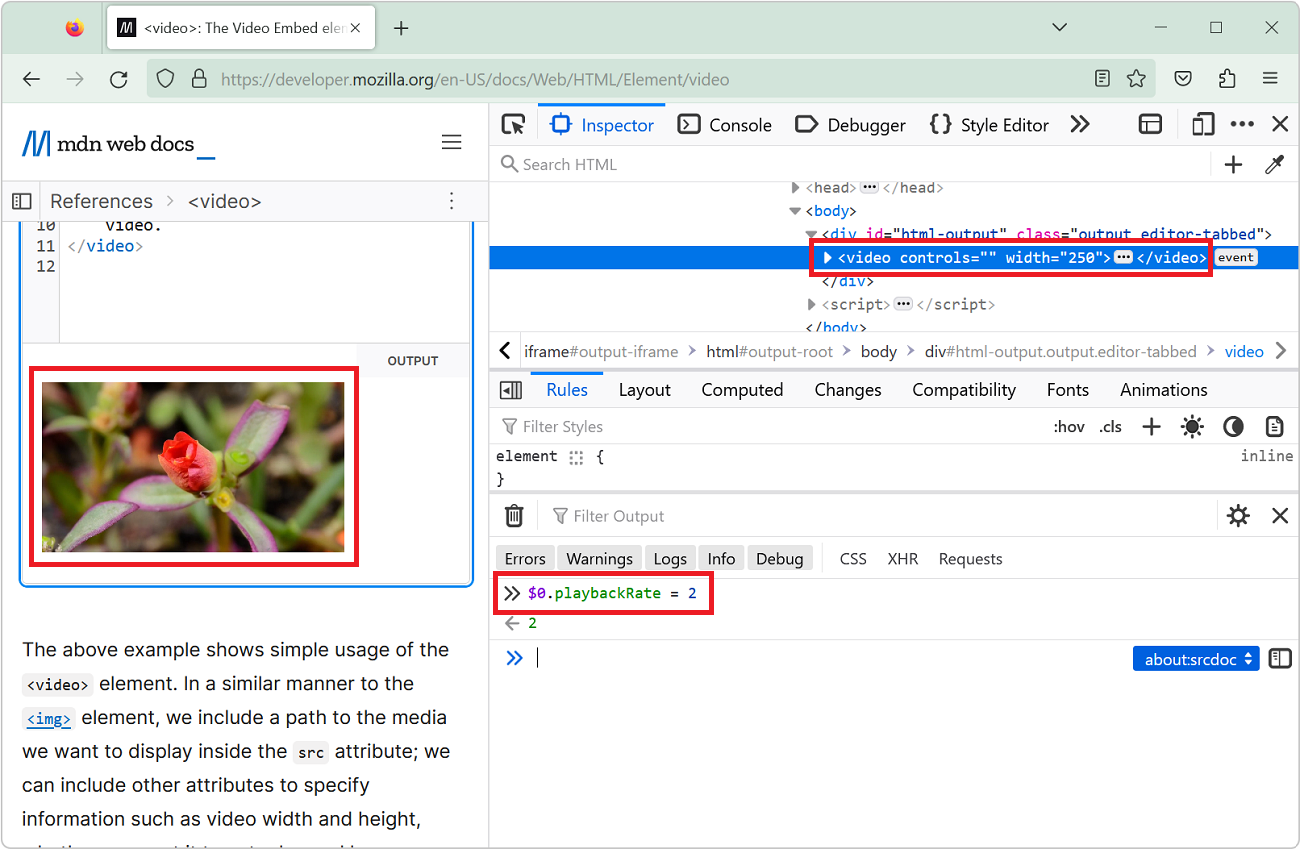 You can speed up or slow down a video on a website by using the playbackRate property of the video element. This can be very useful for when the website makes it tricky to do this in the UI! Open Dev... Read more
 -
Debug your print CSS styles by simulating print media
 If you work on a webpage that's supposed to be printed, you probably want to test your print CSS styles. You can use your browser's print preview of course, but what if you need to debug the CSS? DevT... Read more
 -
Measure arbitrary distances in the page
 Do you need to find out the dimensions of any element or area in the page? Or perhaps the distance between two things? If you do, Firefox DevTools may be the right tool for the job. First, enable the... Read moreCategories: Supported by:
 -
Replay a XHR request
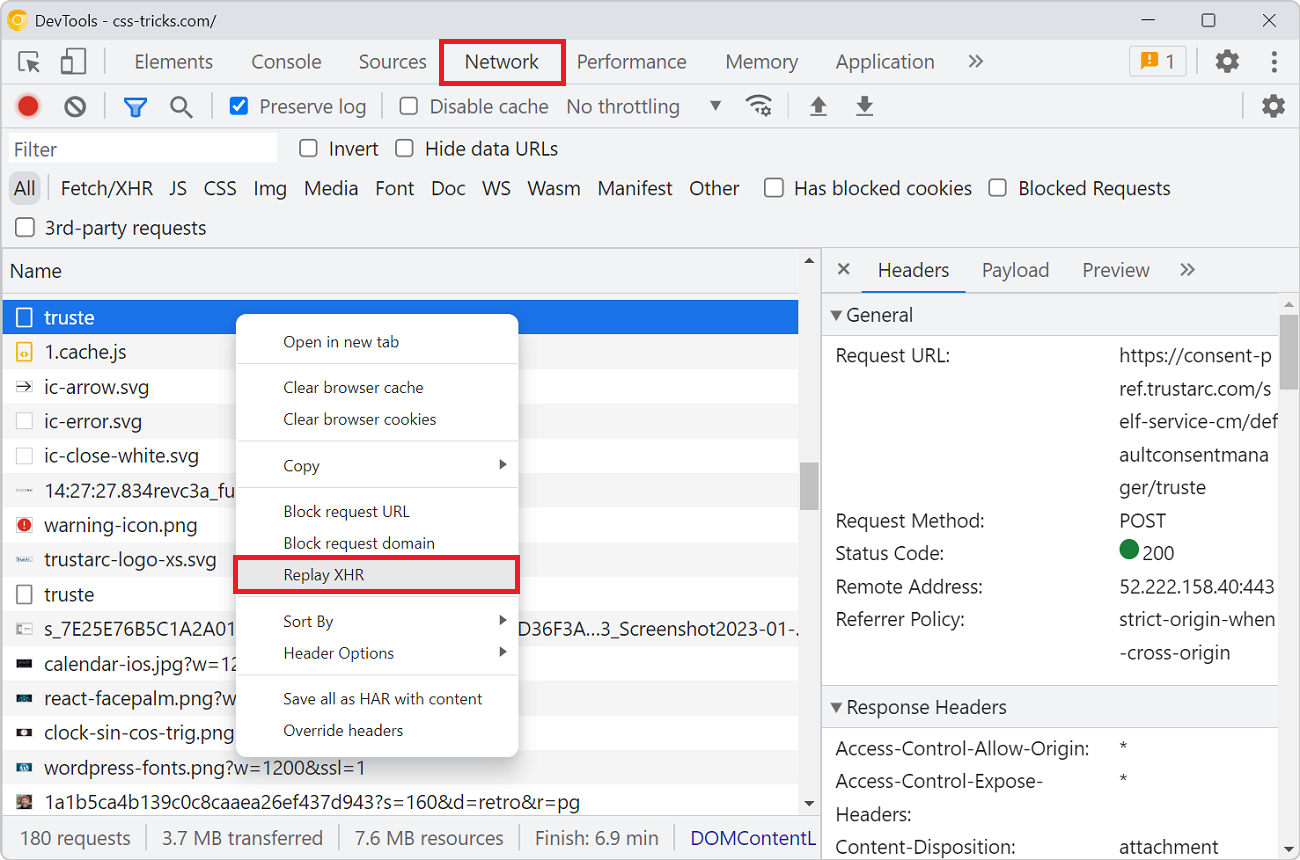 When you're debugging an XHR request to a backend service that doesn't respond with the right things it can be useful to send the request over and over again. Reloading the entire page to do so is ted... Read more
 -
Find broken links
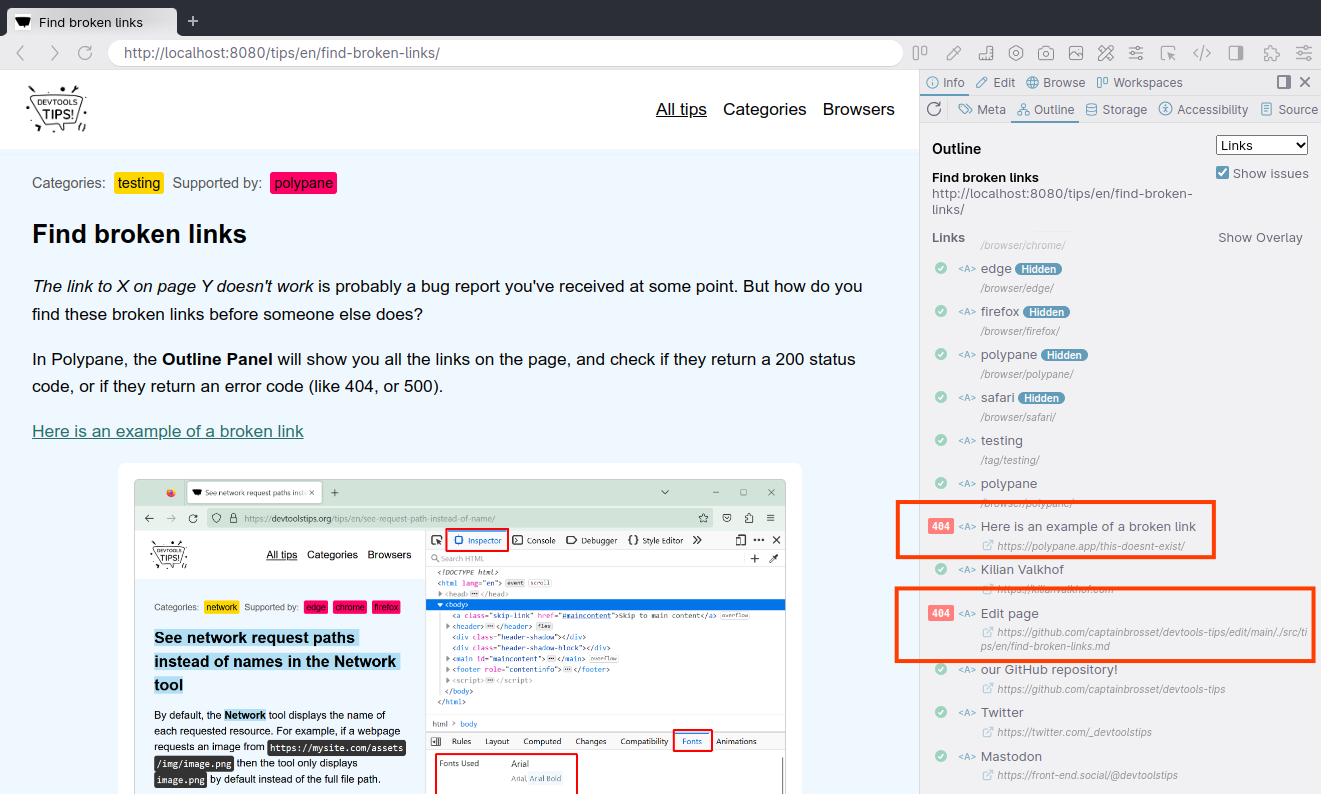 The link to X on page Y doesn't work is probably a bug report you've received at some point. But how do you find these broken links before someone else does? In Polypane, the Outline Panel will show y... Read moreCategories: Supported by:
 -
List the fonts used on a page, or an element
 "What font is that?" or "Why is this font used?" are probably questions you've asked yourself while working on a website design. However, it's not always easy to know which fonts a... Read more
 edge
edge
 chrome
 firefox
 safari
 polypane