184 DevTools Tips
-
See network request paths instead of names in the Network tool
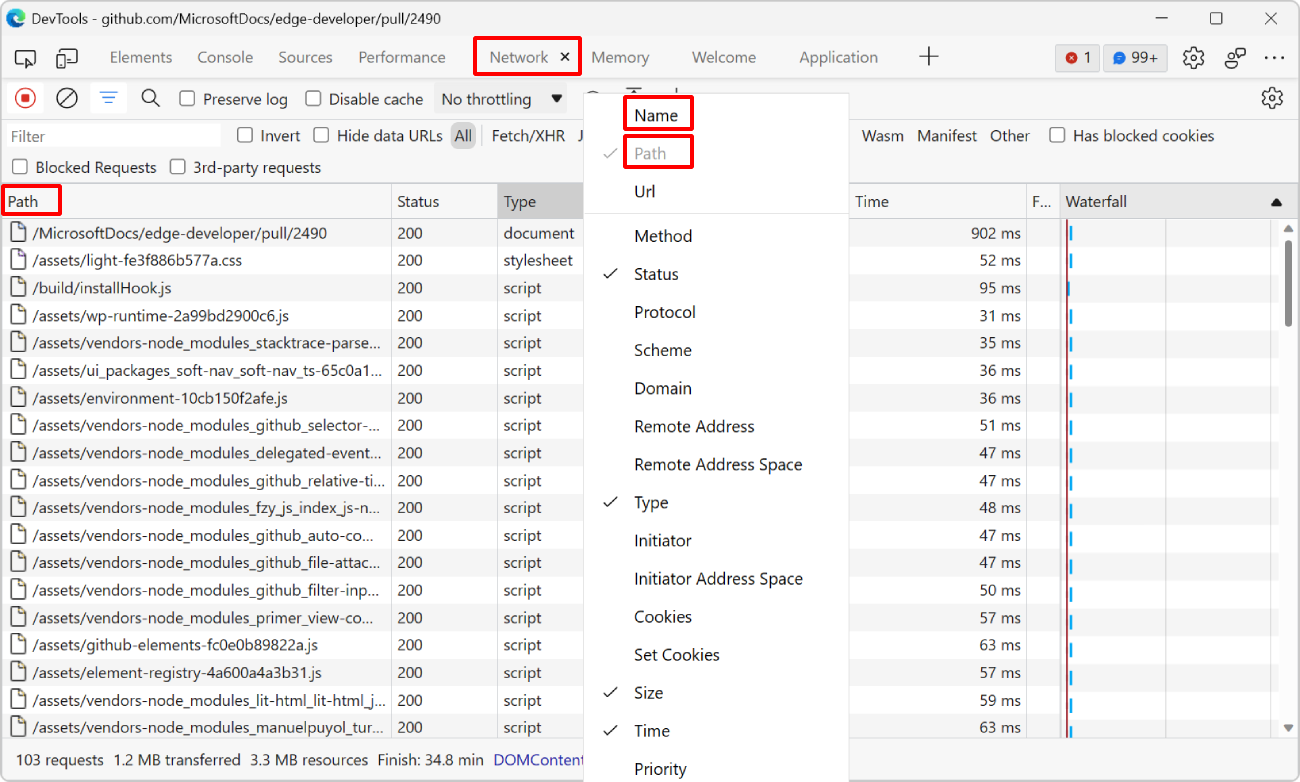 By default, the Network tool displays the name of each requested resource. For example, if a webpage requests an image from https://mysite.com/assets/img/image.png then the tool only displays image.pn... Read more
 -
Display the current framerate of your webpage
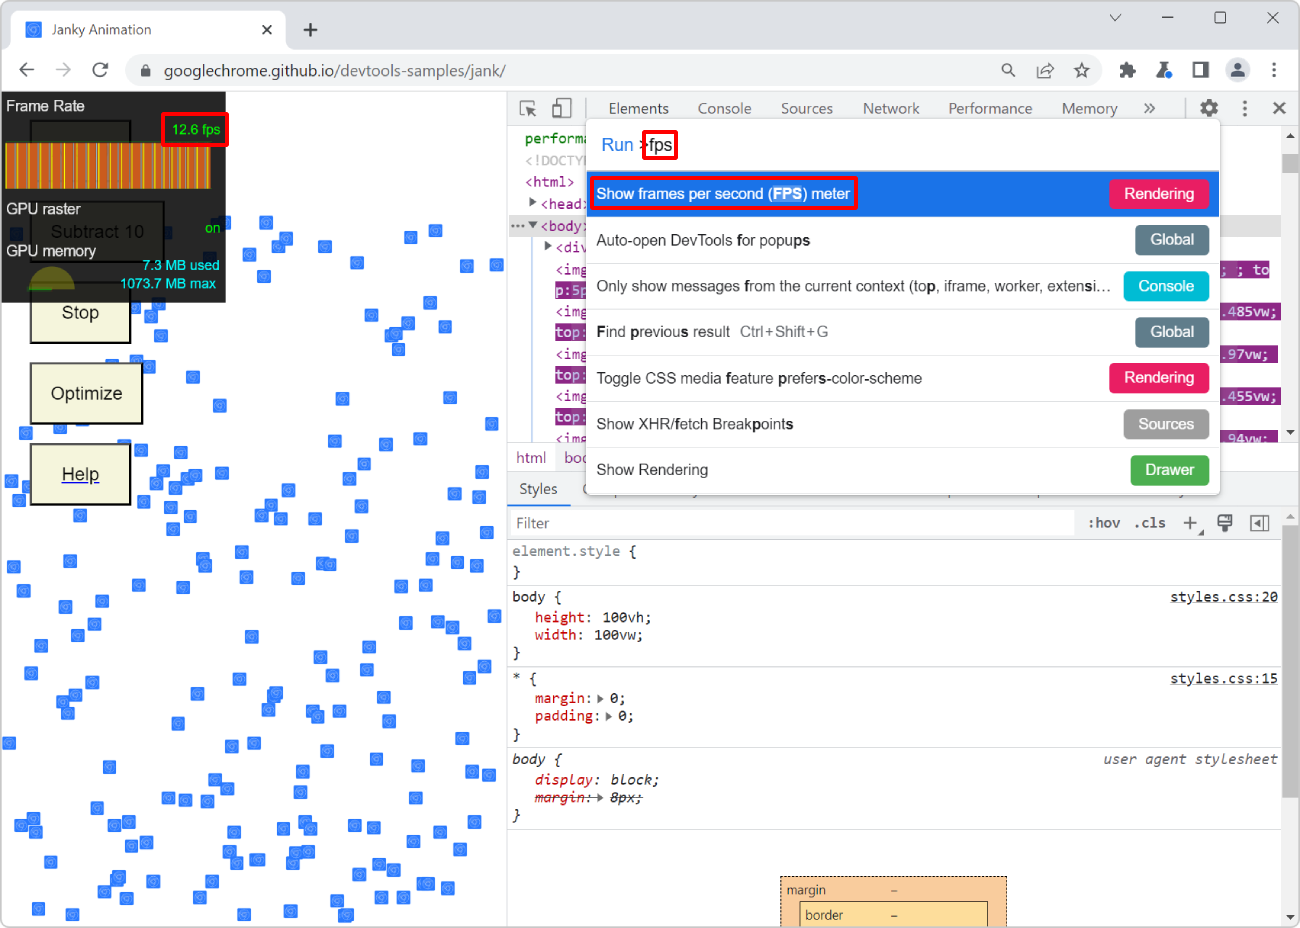 For a super smooth user experience on your website or app, it's better if the browser manages to render your page at a high framerate. Ideally, this rate should be 60 frames per second (FPS). This giv... Read more
 -
Detect unused CSS and JavaScript code
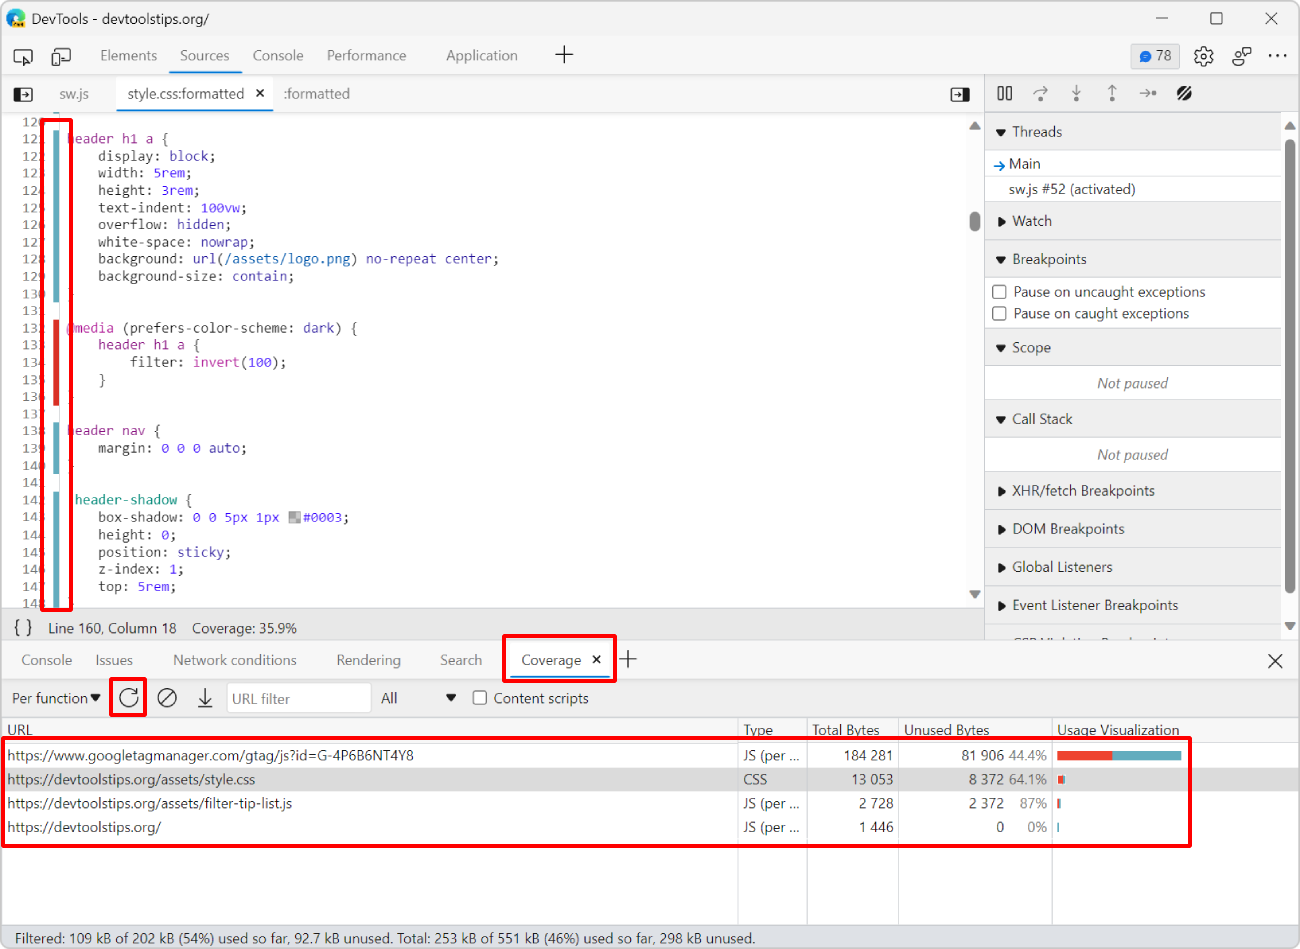 To make sure your webpage loads and appears fast for your users, load only the CSS and JS code that your page requires to appear correctly. If some of your CSS or JS code is only needed later, when th... Read more
 -
Throttle your CPU
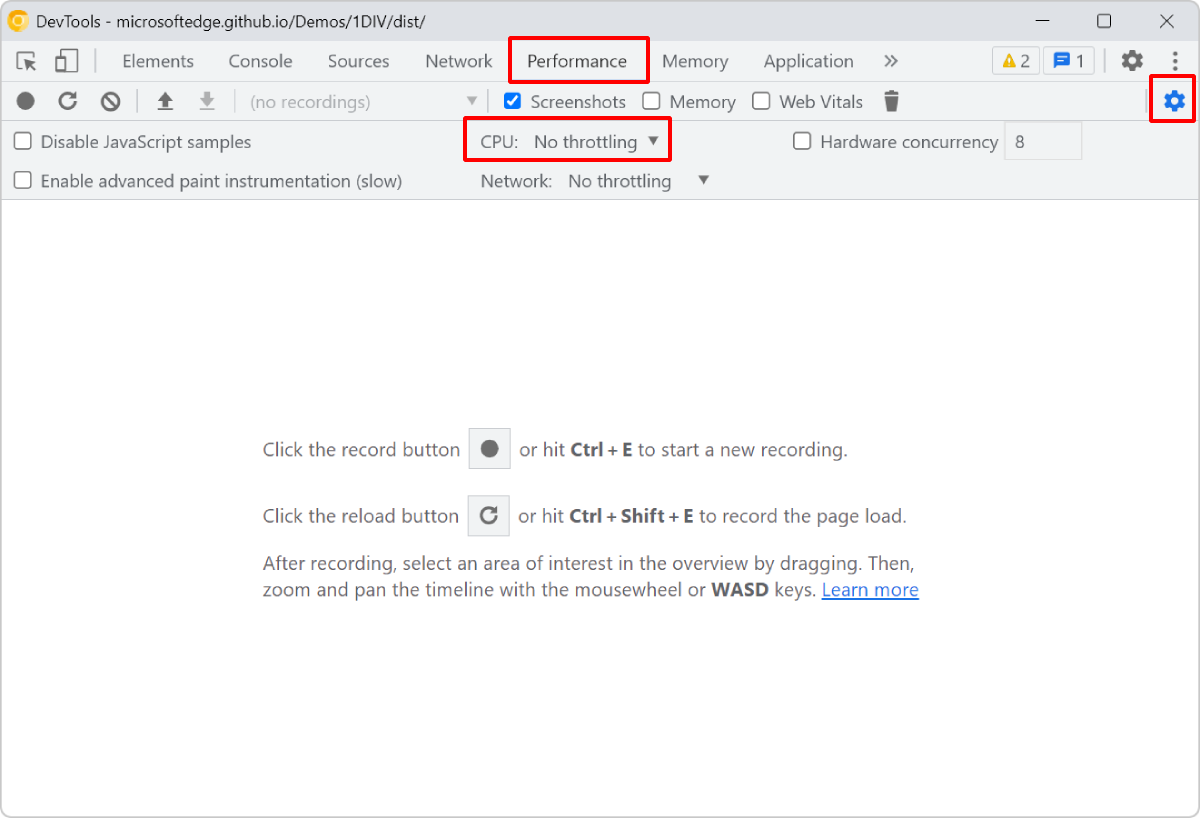 Your development machine is very likely much more powerful than the devices your users have (which are probably low-end mobile devices). Before you ship your new app or site, thinking that it will run... Read more
 -
See the size of the transferred data for images, scripts, or other resources
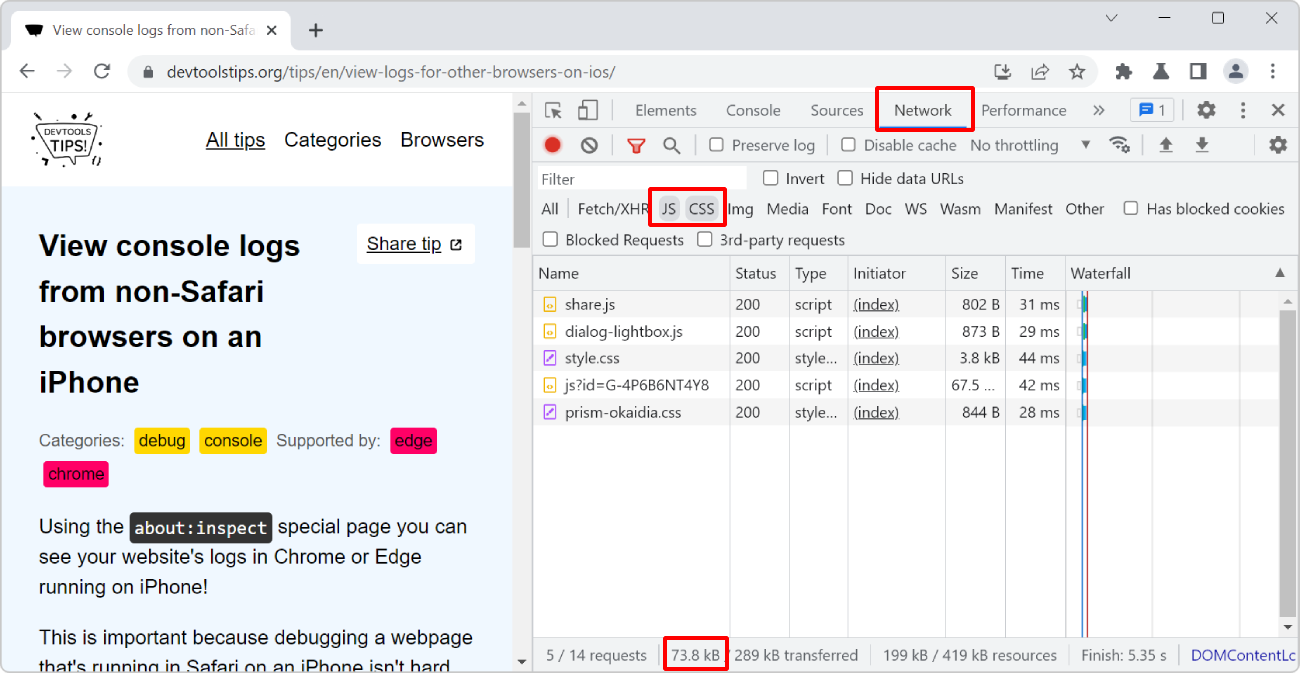 To know how much data your website transfers between the server and the client to display images, or scripts, or anything else: Open the Network tool. Refresh the page to make sure the list of req... Read more
 -
View console logs from non-Safari browsers on an iPhone
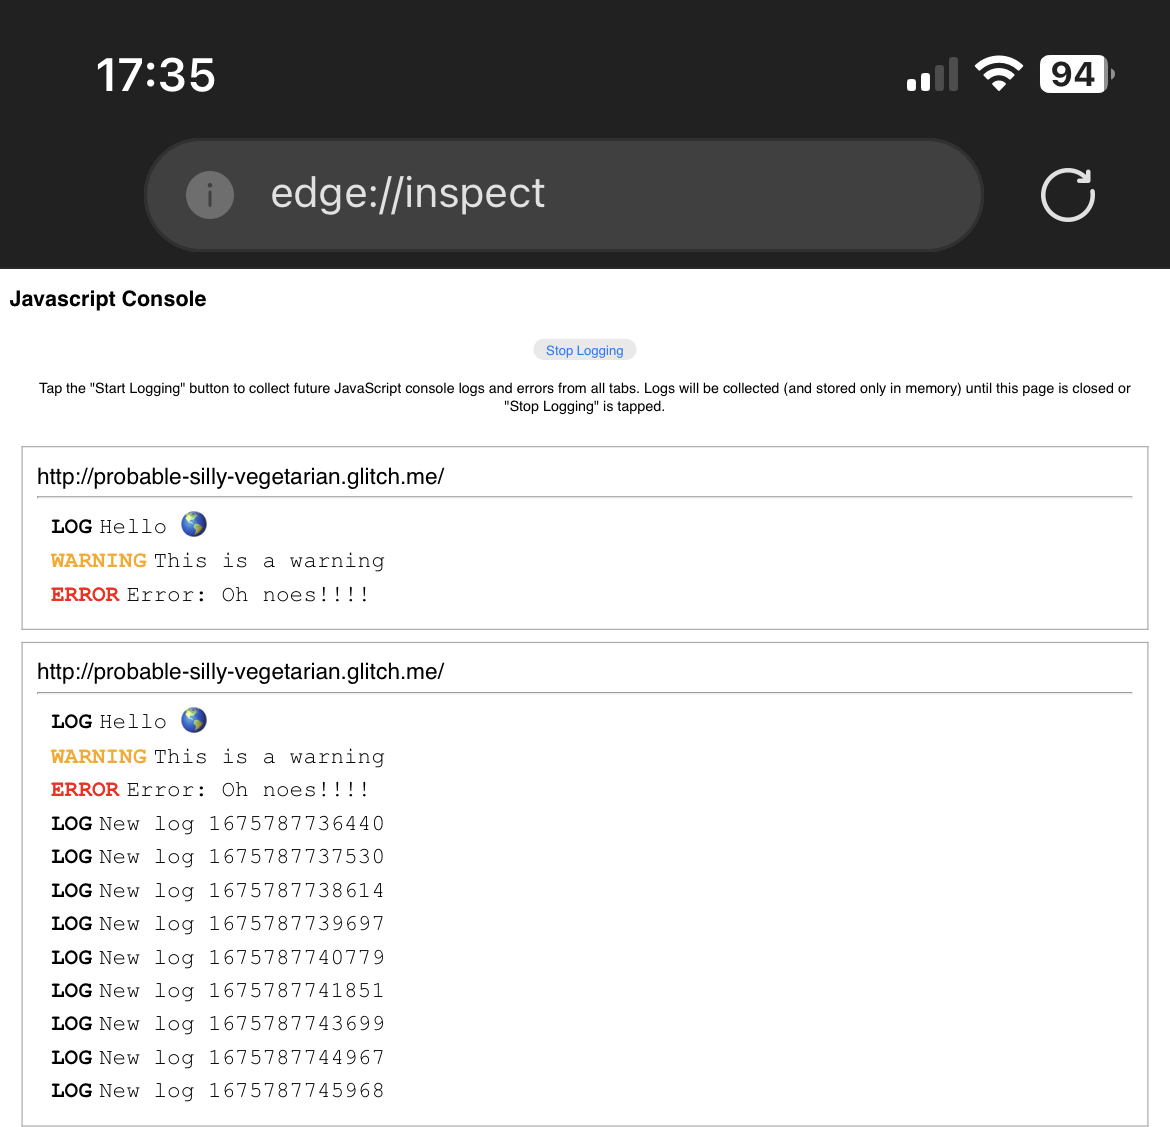 Using the about:inspect special page you can see your website's logs in Chrome or Edge running on iPhone! This is important because debugging a webpage that's running in Safari on an iPhone isn't hard... Read more
 -
Disable abusive debugger statements that prevent inspecting websites
 Some websites make it impossible to use DevTools by adding debugger statements in their code. The statements don't do anything for normal users, but as soon as DevTools is opened, the JavaScript execu... Read more
 -
Emulate color schemes
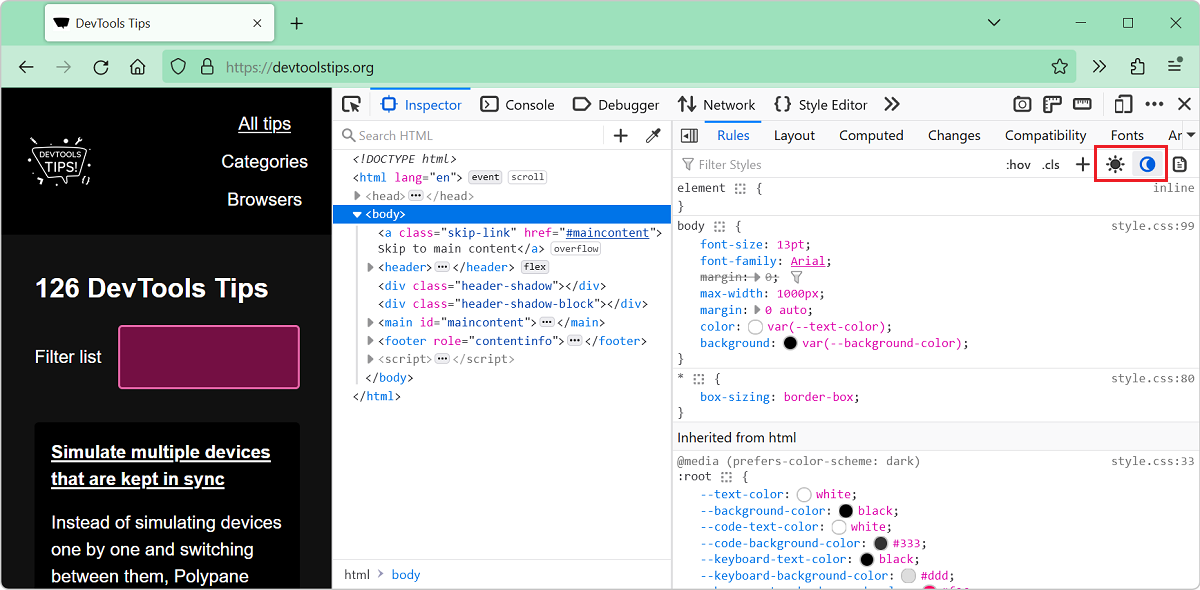 In CSS, you can use the prefers-color-scheme media feature (docs) to detect if the user prefers using a light or a dark theme in their operating system. This is useful to style your website in a way t... Read more
 -
Simulate multiple devices that are kept in sync
 Instead of simulating devices one by one and switching between them, Polypane supports testing on multiple simulated devices and viewports at the same time. It lets you test different simulated device... Read moreCategories: Supported by:
 -
Show web vitals
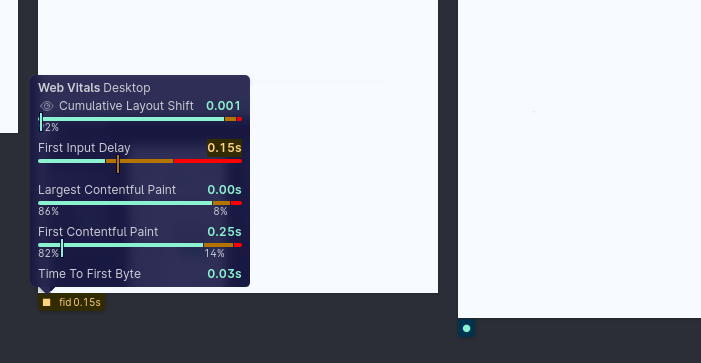 Web vitals are a set of metrics that help you determine how well-built your page is. You can learn more about them here. These scores can be obtained with various online checks like PageSpeed Insights... Read moreCategories: Supported by:
 -
Manipulate global objects on page load, before other scripts run
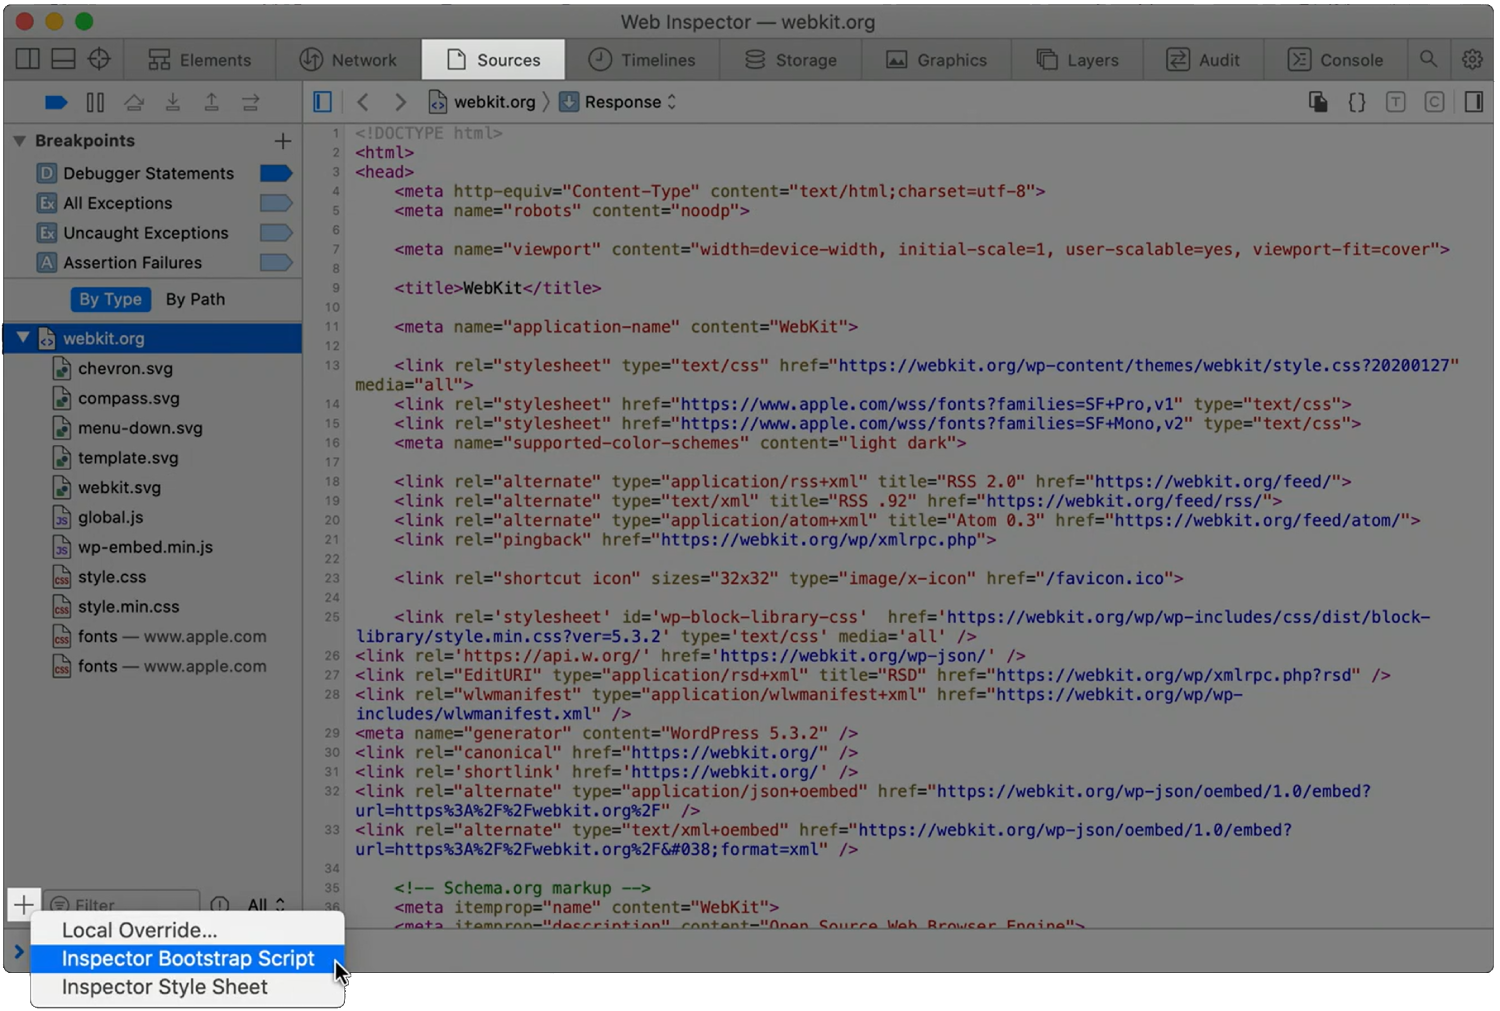 When a page loads, and all of its global objects are ready, but before the JavaScript code of the page actually kicks-in, is a great time to inject debugging code. For example, it might be useful to r... Read moreCategories: Supported by:
 -
Autofill forms for testing
 In Polypane you can right-click any form on the page and select Autofill form to add dummy values to all input elements. This prevents you from having to go field-by-field to fill in all required fiel... Read moreCategories: Supported by:
 -
Reload a page when there's changes on disk
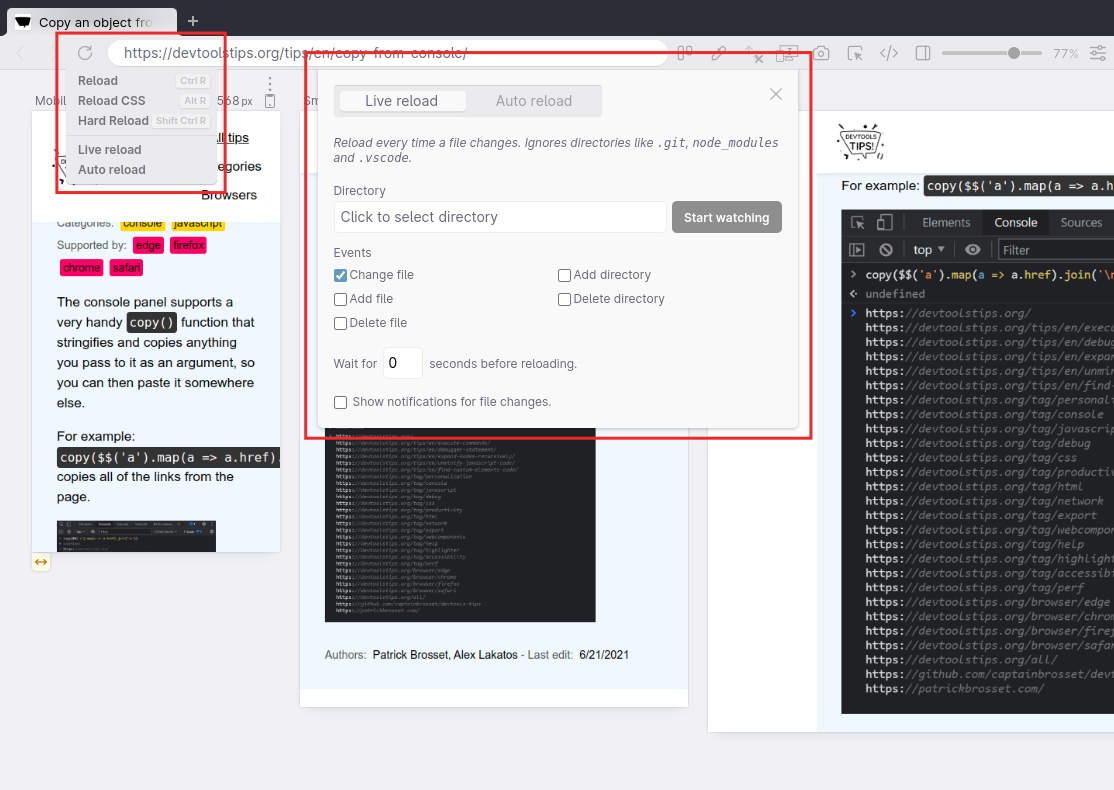 While working on a page locally and you're not using a hot reloading dev server, you need to reload the browser yourself to see the change. You need to do this every time you save a file. Wouldn't it... Read moreCategories: Supported by:
 -
Test your PWA protocol handlers
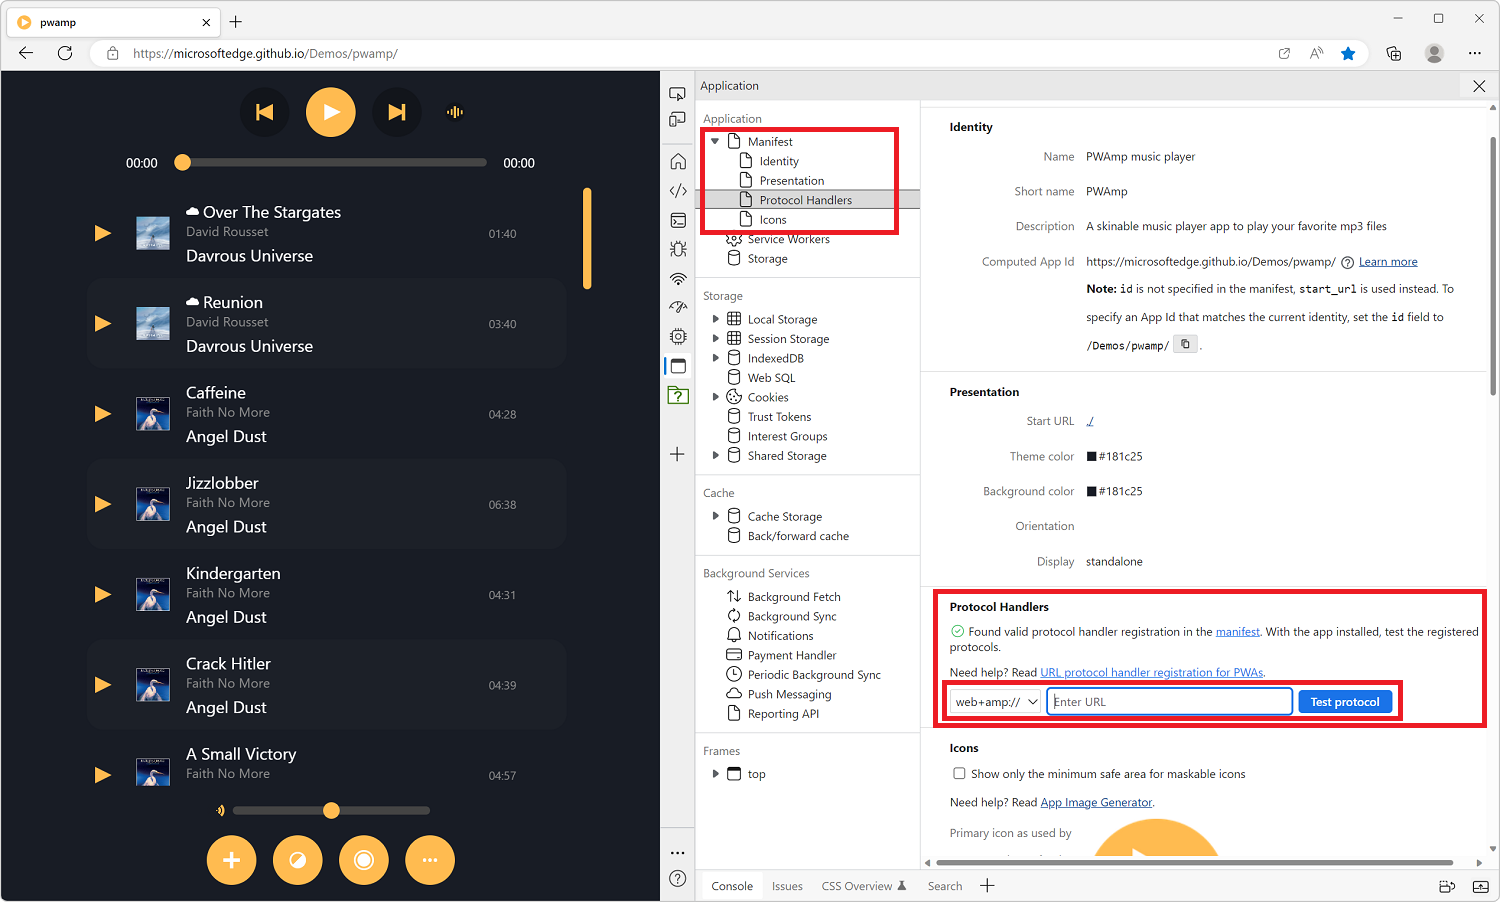 Progressive Web Apps (PWA) can register themselves to handle URIs with pre-defined or custom protocols (such as mailto, geo, or web+foo). This is a great capability that makes it possible for installe... Read more
 -
See formatted JSON responses
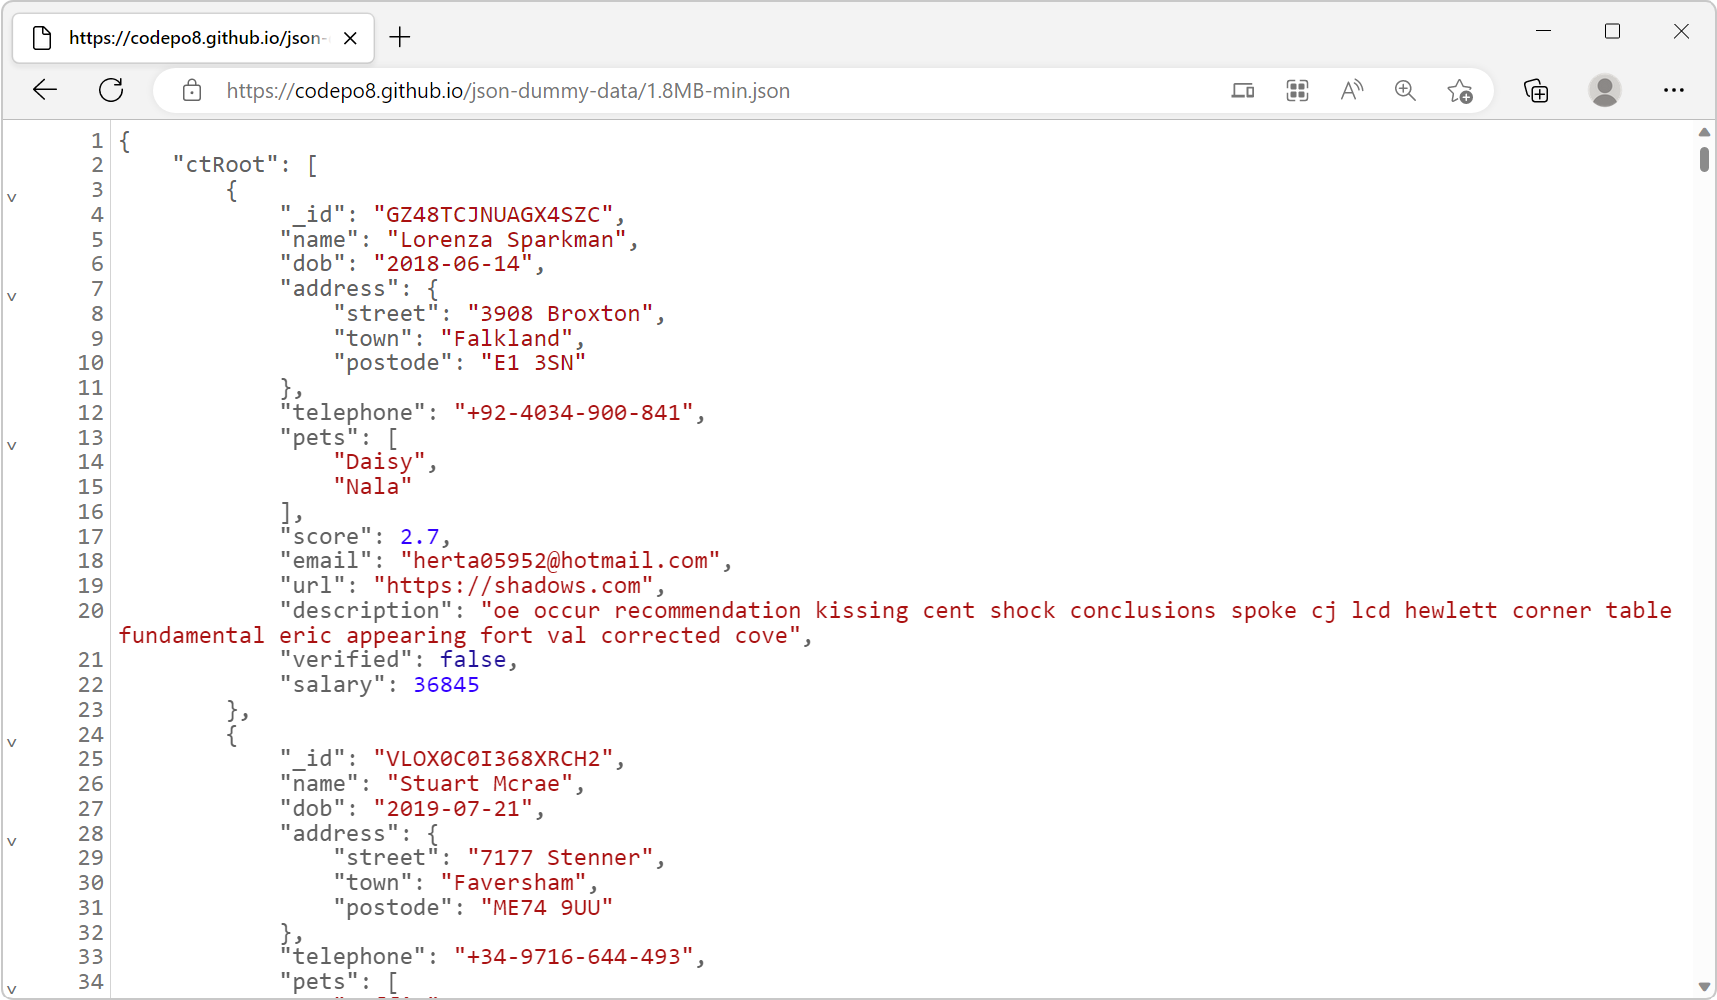 Edge (starting with 110), Firefox and Polypane all have a very nice JSON viewer tool that makes it easy to view JSON responses from your server directly in the browser window. You don't even need to o... Read more
 -
Emulate idle detection states
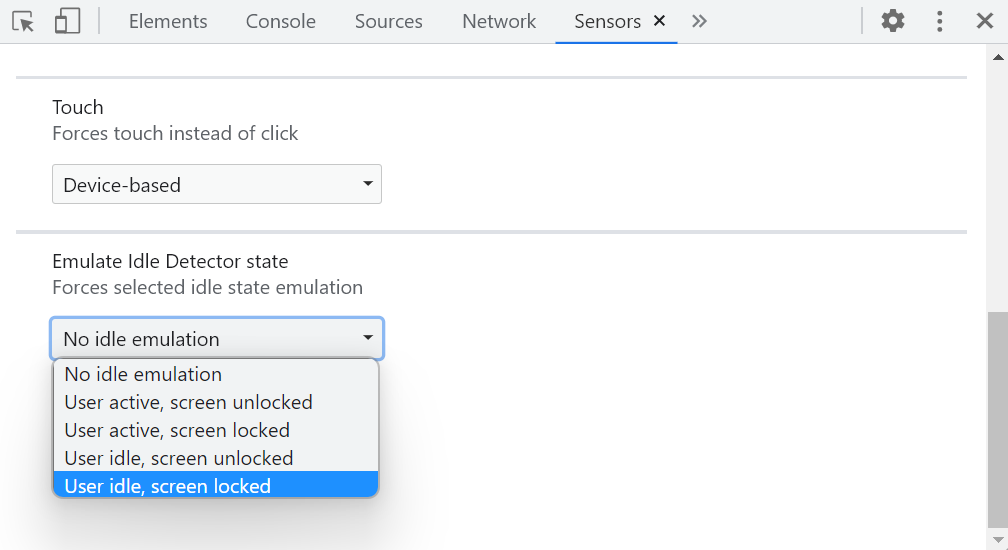 The Idle Detection API is useful for web developers to detect when the user isn't interacting with their device. This can be useful for chat applications, for example, to mark the user as away. Note:... Read moreCategories: Supported by:
 -
Debug unwanted scrollbars
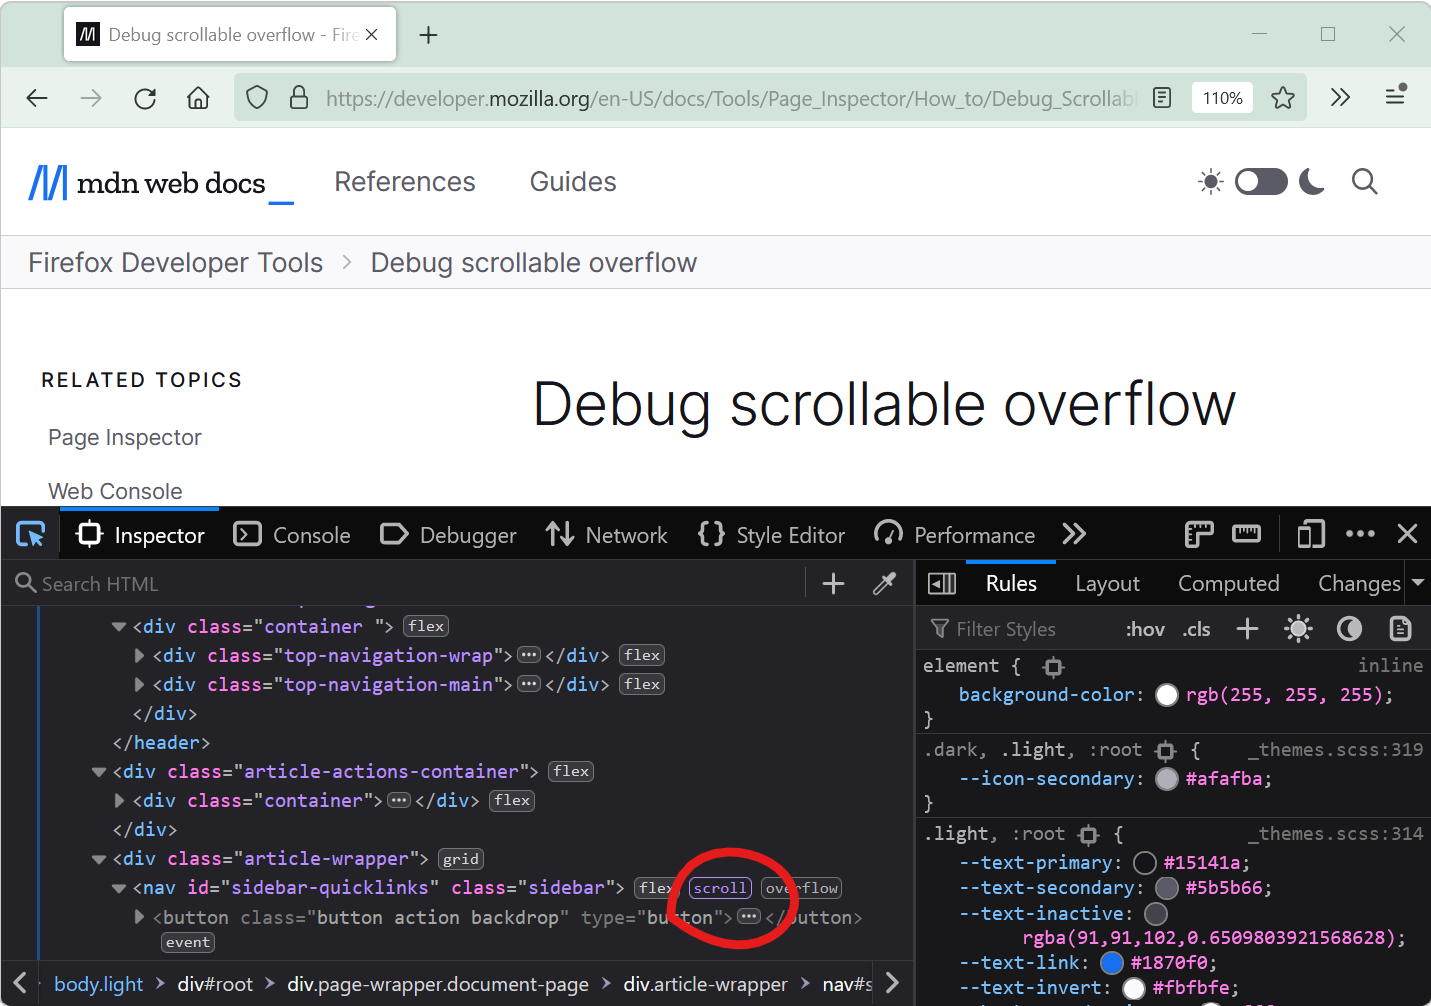 Scrollbars can sometimes appear on a webpage unexpectedly. When this happens, finding which HTML element is the cause of the scrollbars isn't always straightforward. DevTools provides features that he... Read more
 -
Find the most expensive CSS selectors
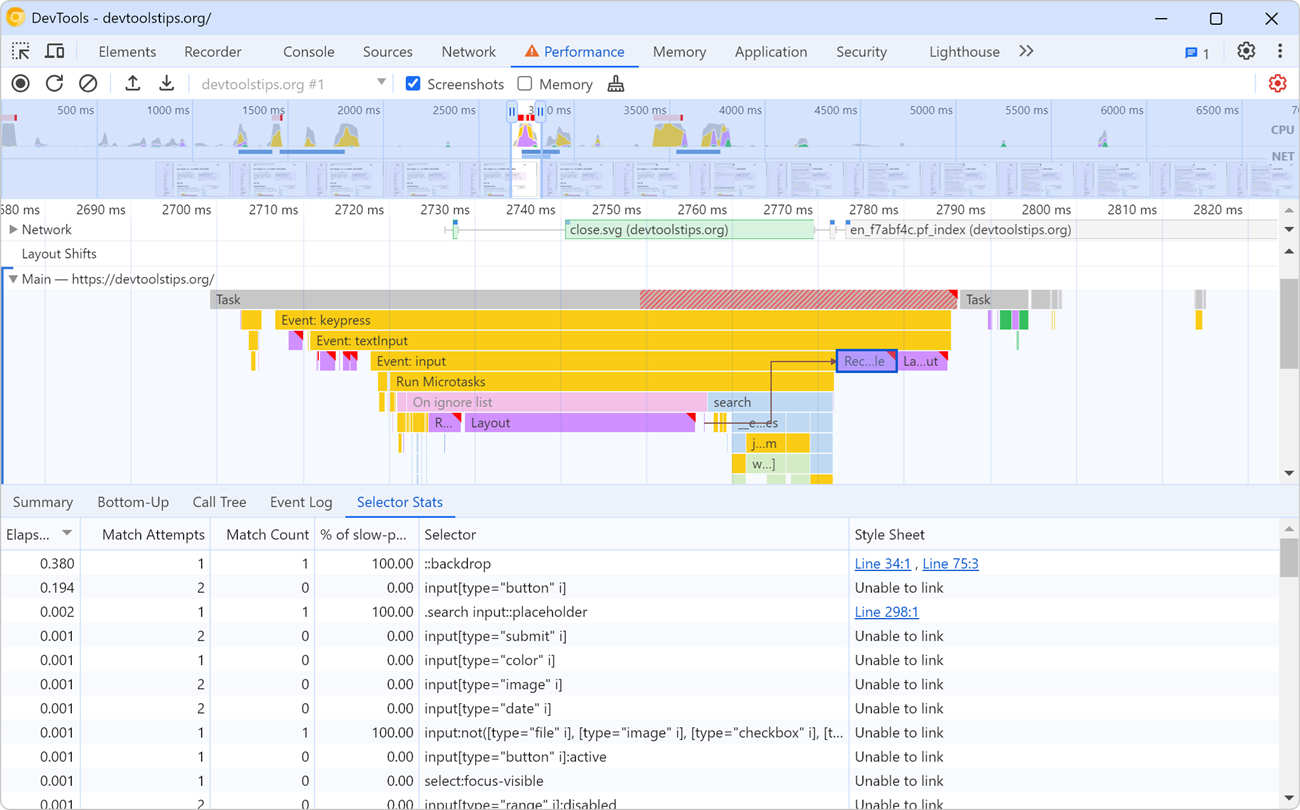 When it comes to improving web rendering performance, we often spend time working on JavaScript code. But CSS has an important role to play too in how fast a web page renders. CSS selectors, in partic... Read more
 -
List all supported console functions
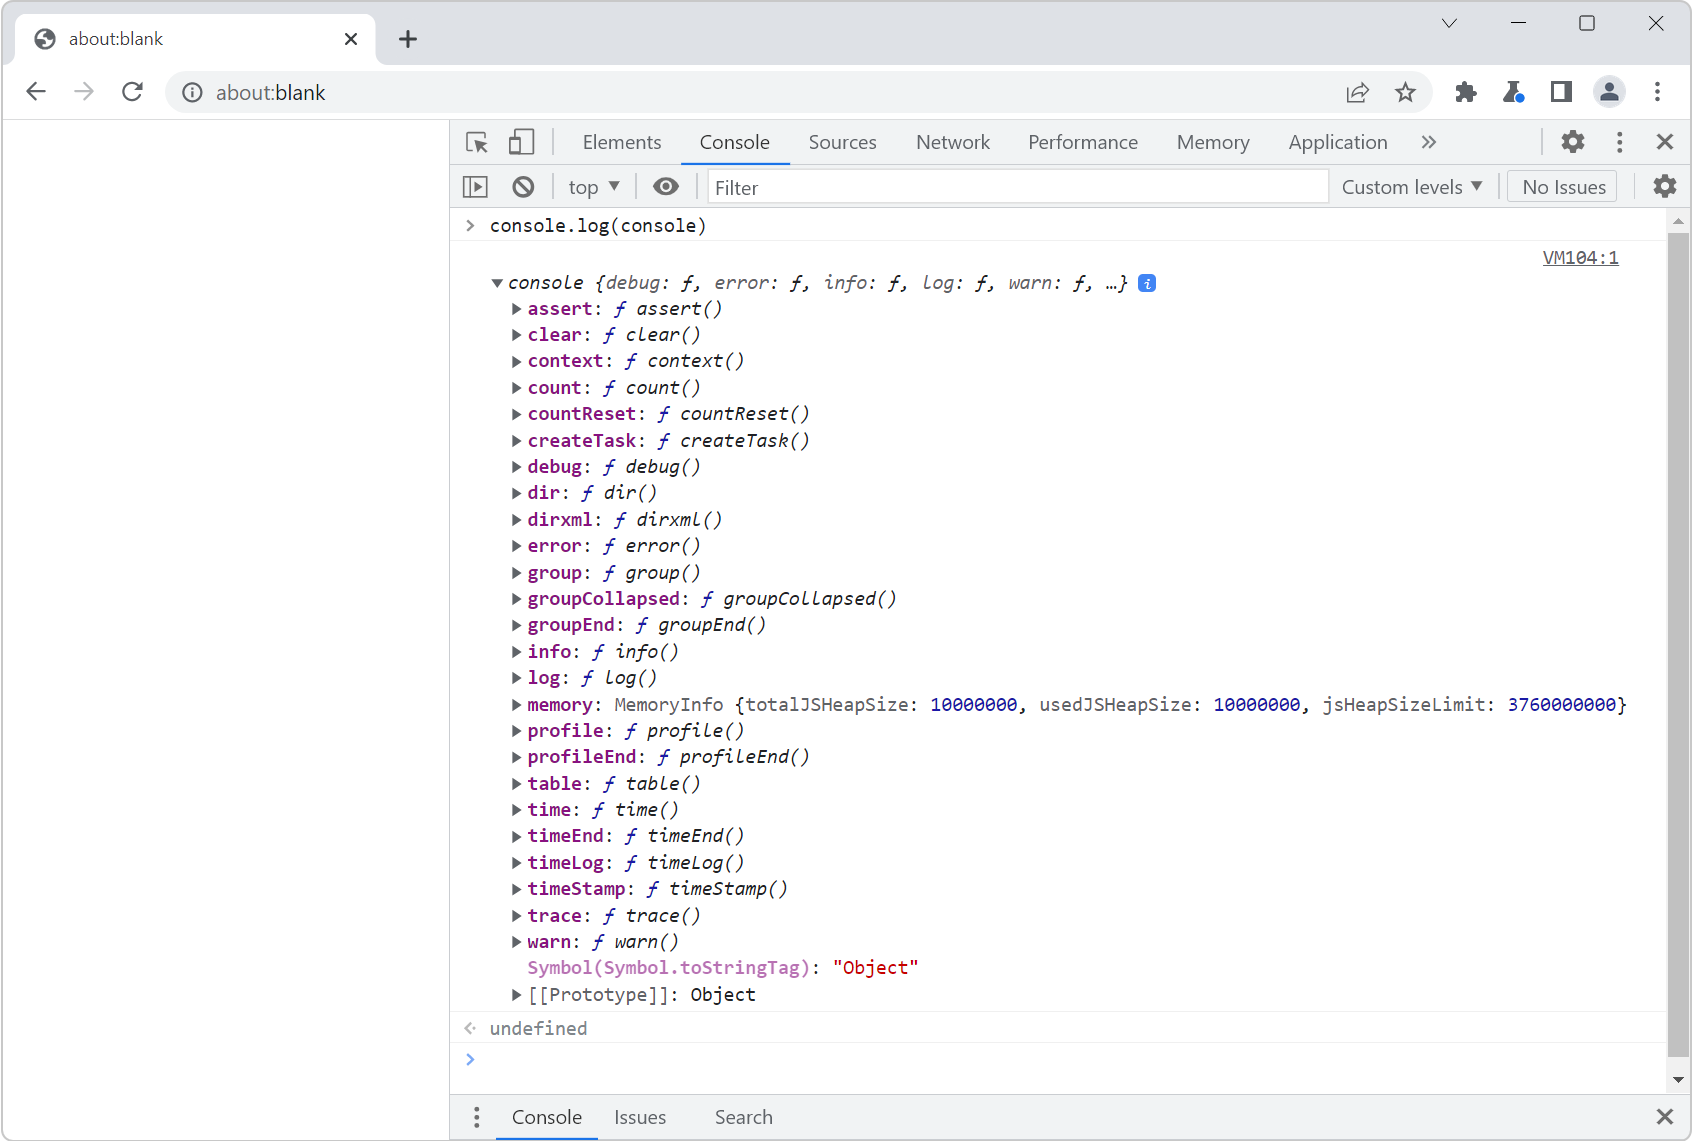 You've probably already used console.log() in your code to print debugging values to the Console tool in DevTools. But the console namespace actually has many other functions too! To list them all, op... Read more
 -
Hide or pin the information tooltip while inspecting page elements
 When selecting elements from the page using the inspect tool, the hovered elements get highlighted, and an information tooltip follows your mouse around and gives you information about the hovered ele... Read more
 -
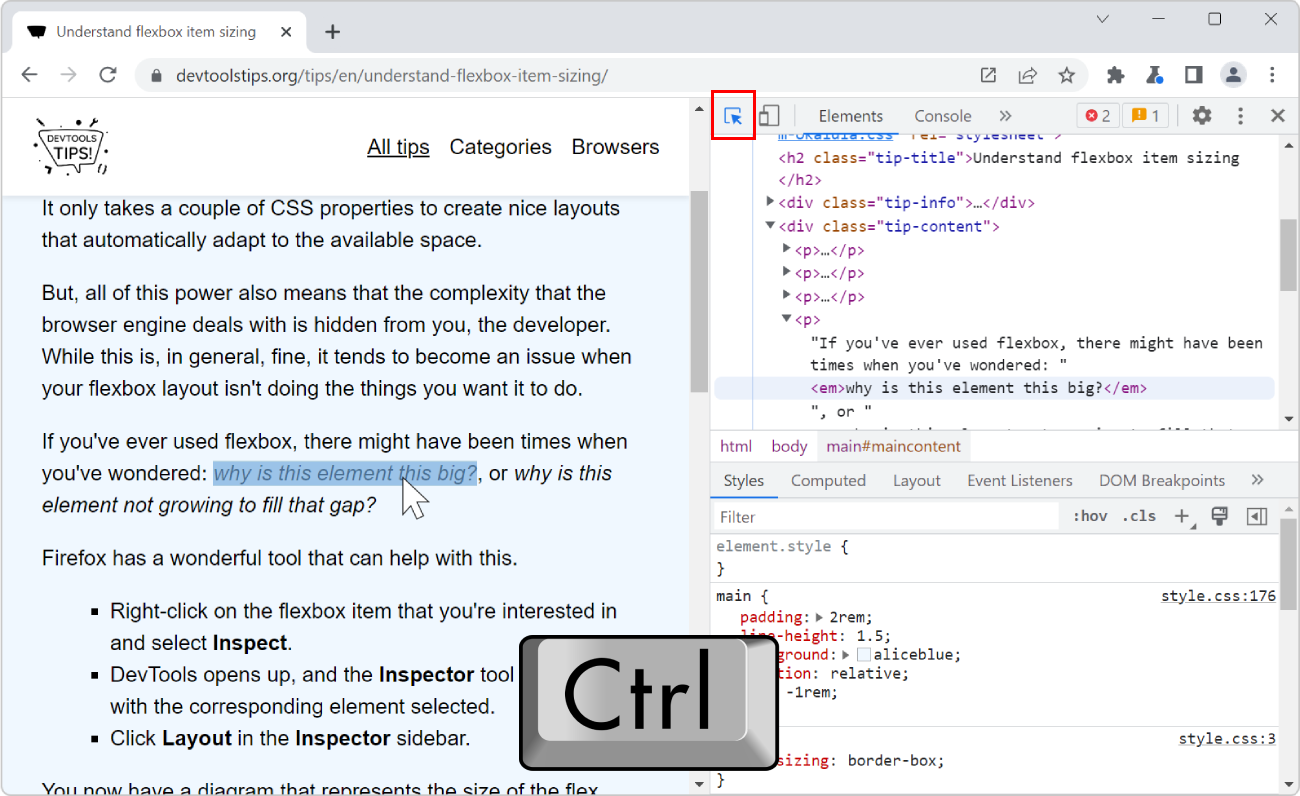
Understand flexbox item sizing
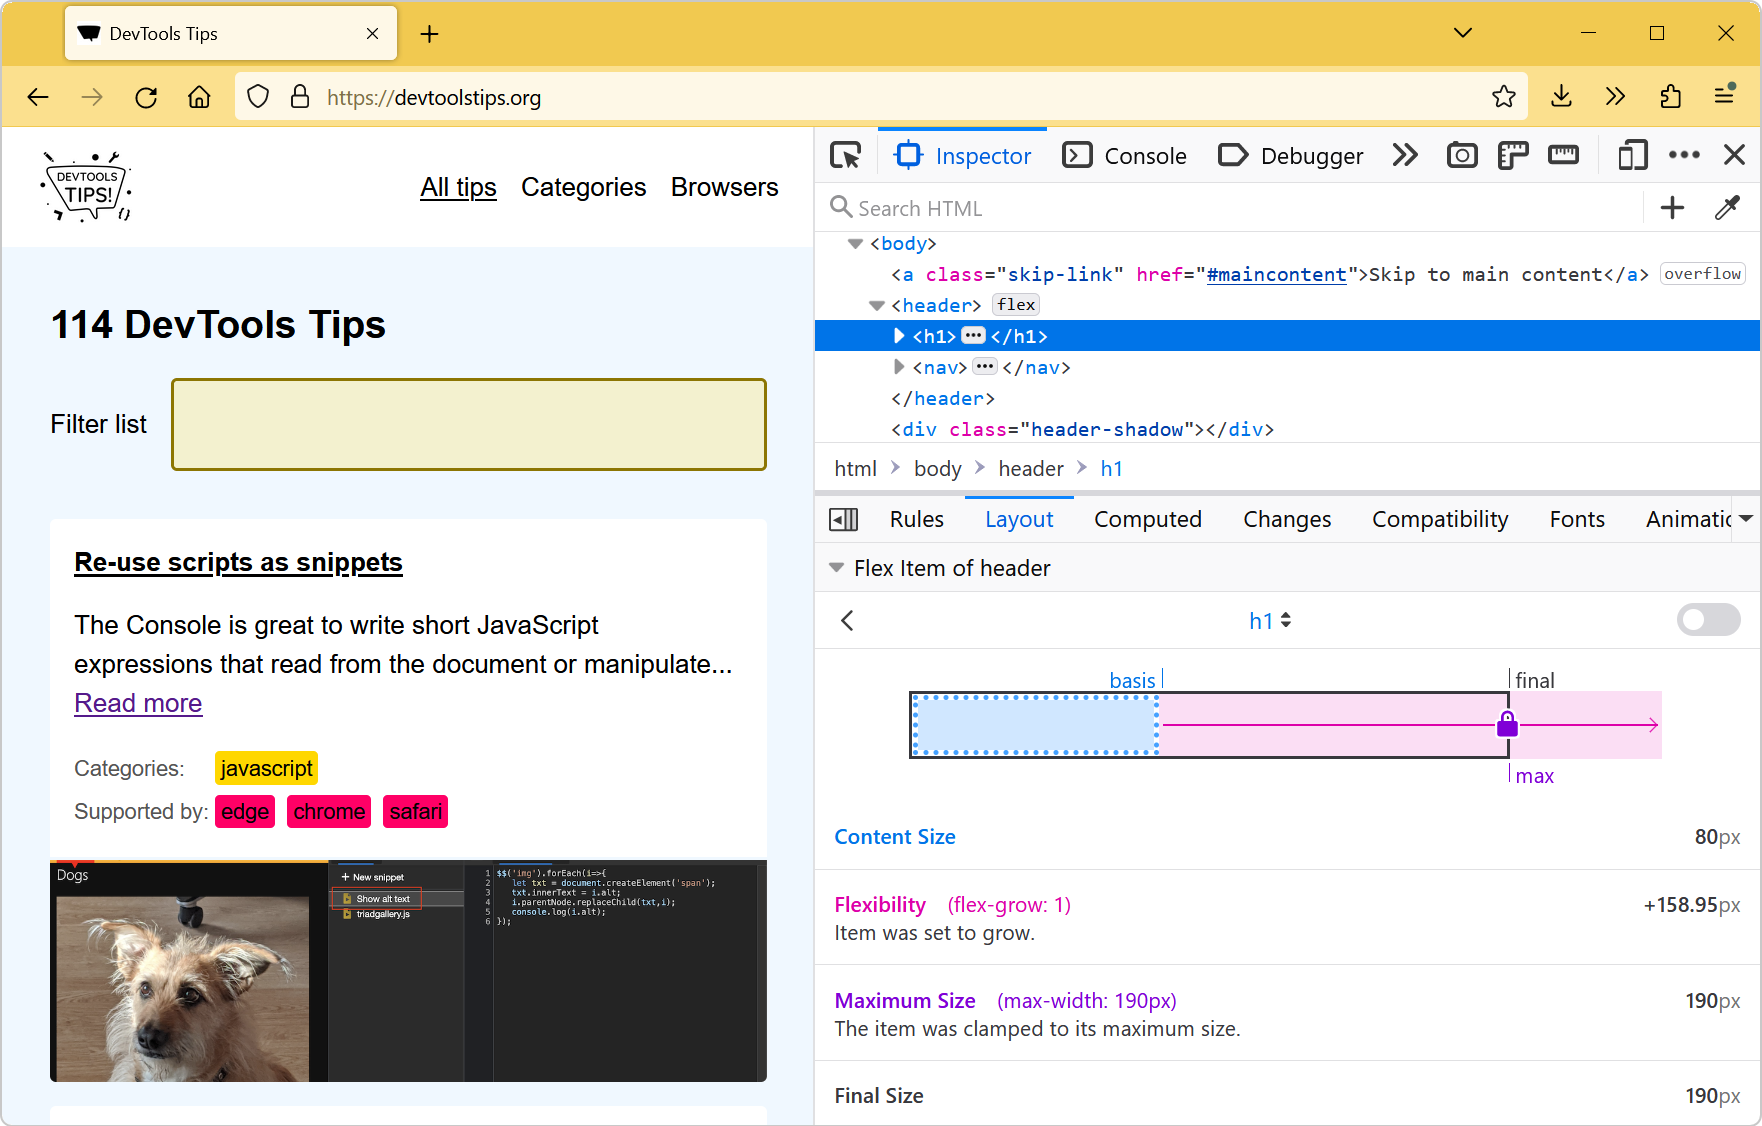 Flexbox is a great way to easily distribute elements and empty space in a row or a column, and create interesting layouts. It only takes a couple of CSS properties to create nice layouts that automati... Read moreCategories: Supported by:
 -
Customize keyboard shortcuts
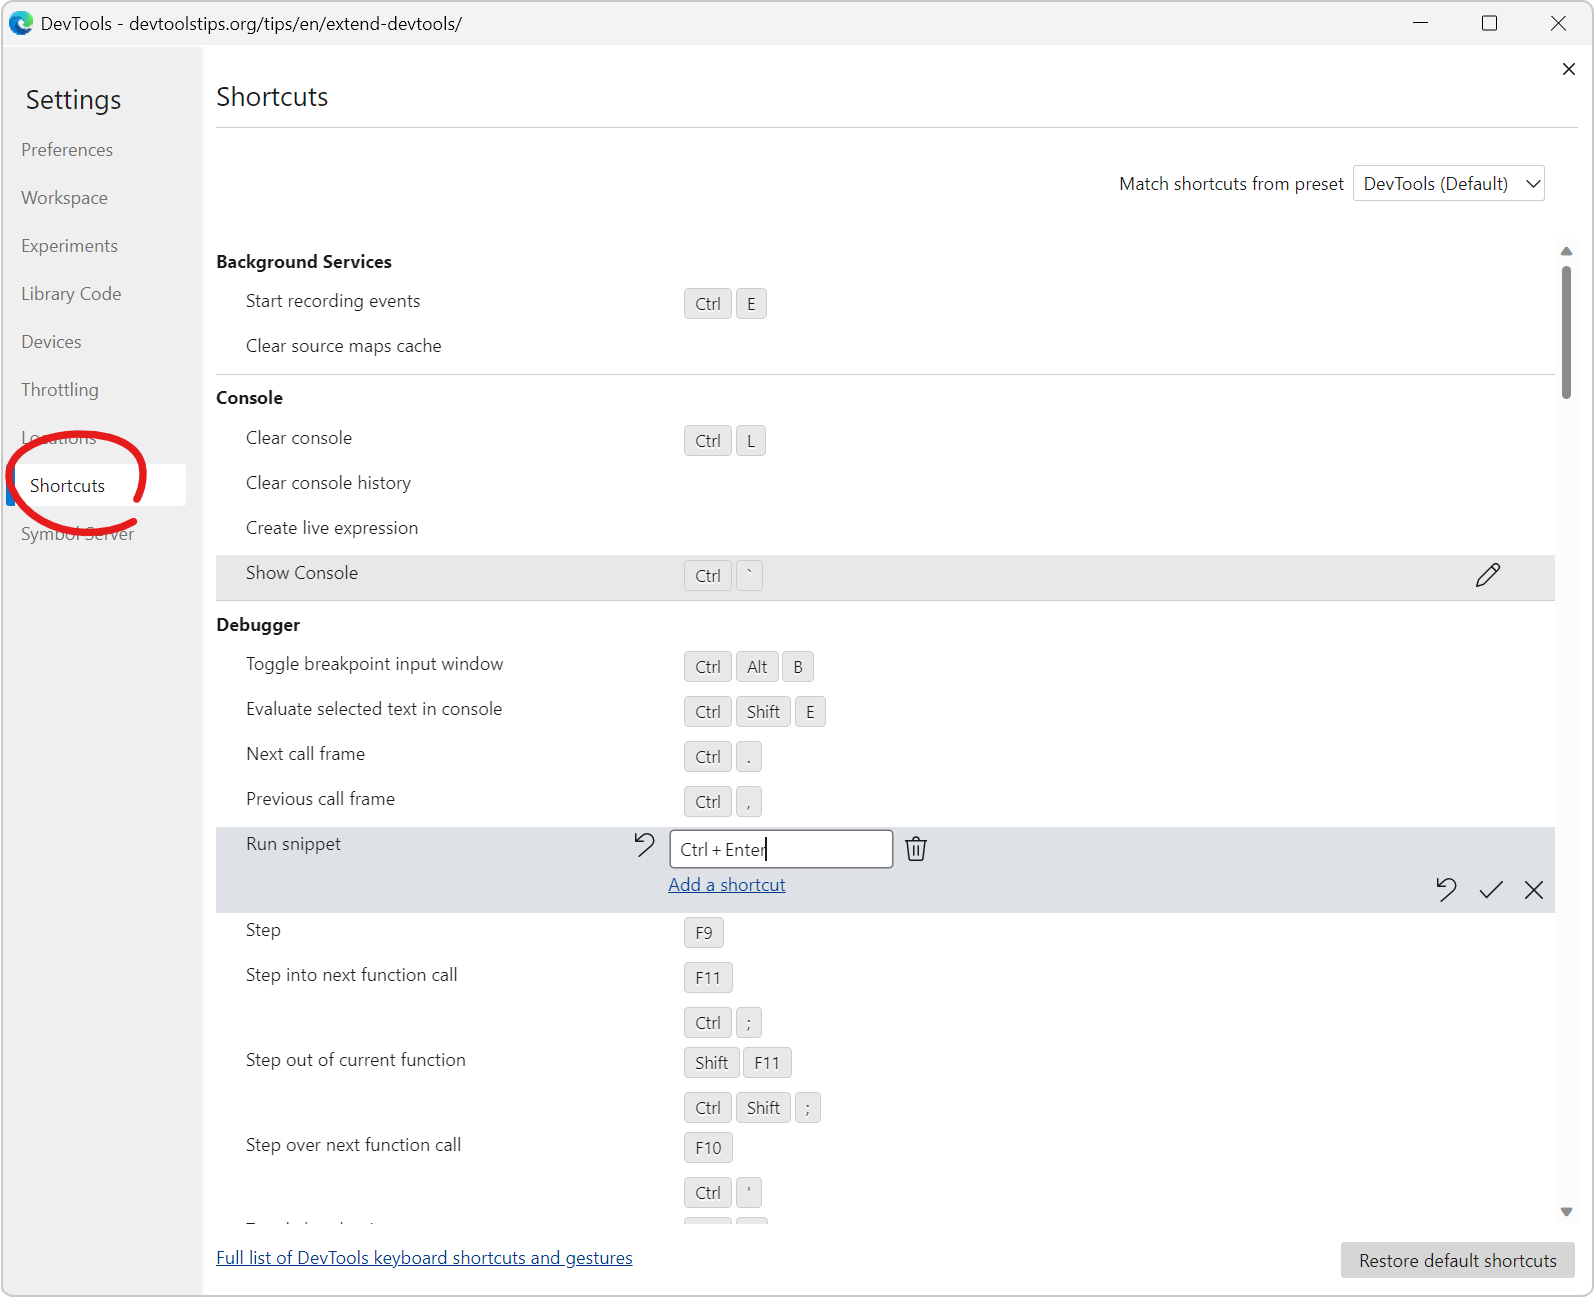 DevTools comes with tons of keyboard shortcuts. Some are well known (like F12 to open DevTools), but there are many others which you might not be familiar with, and which could make your life easier.... Read more
 -
Re-use scripts as snippets
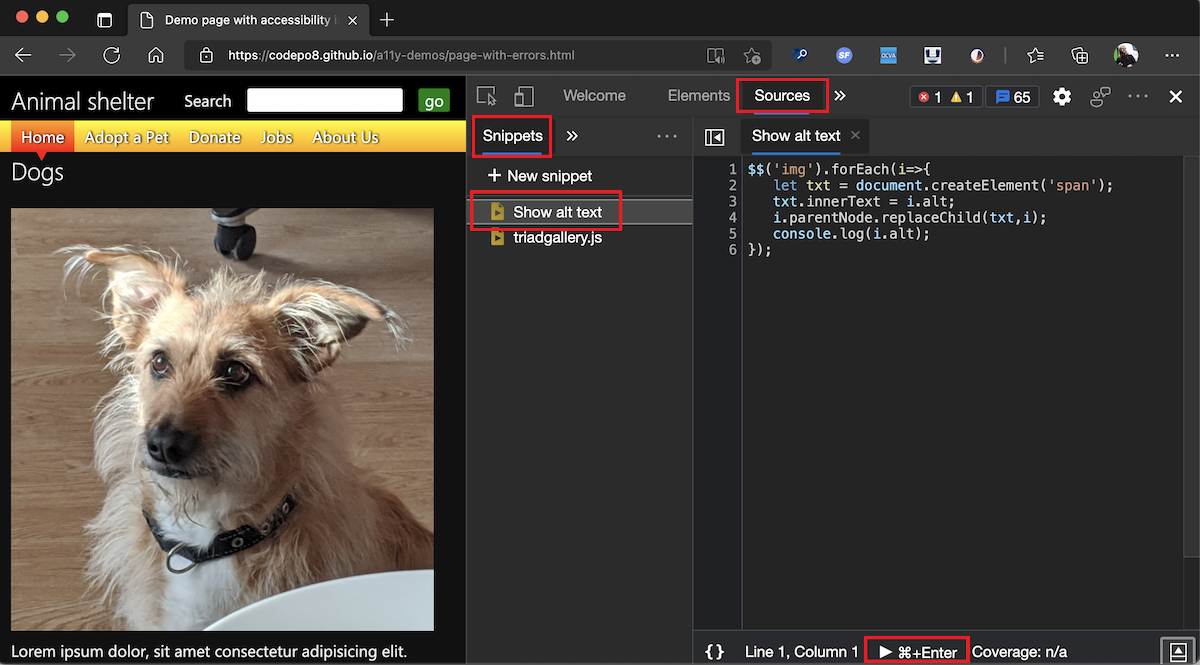 The Console is great to write short JavaScript expressions that read from the document or manipulate it. But it's also a terrible editor. You can actually use a full editor in Edge, Chrome, and Safari... Read more
 -
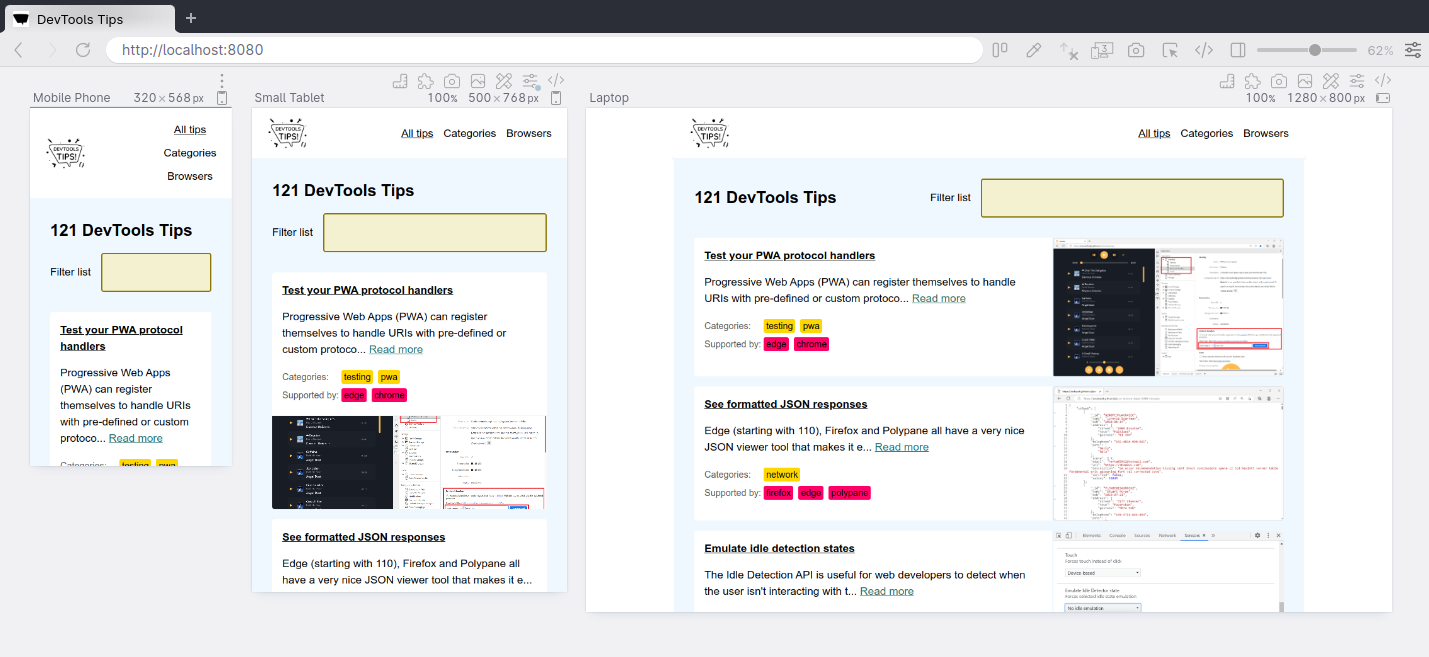
Simulate different devices and screen sizes
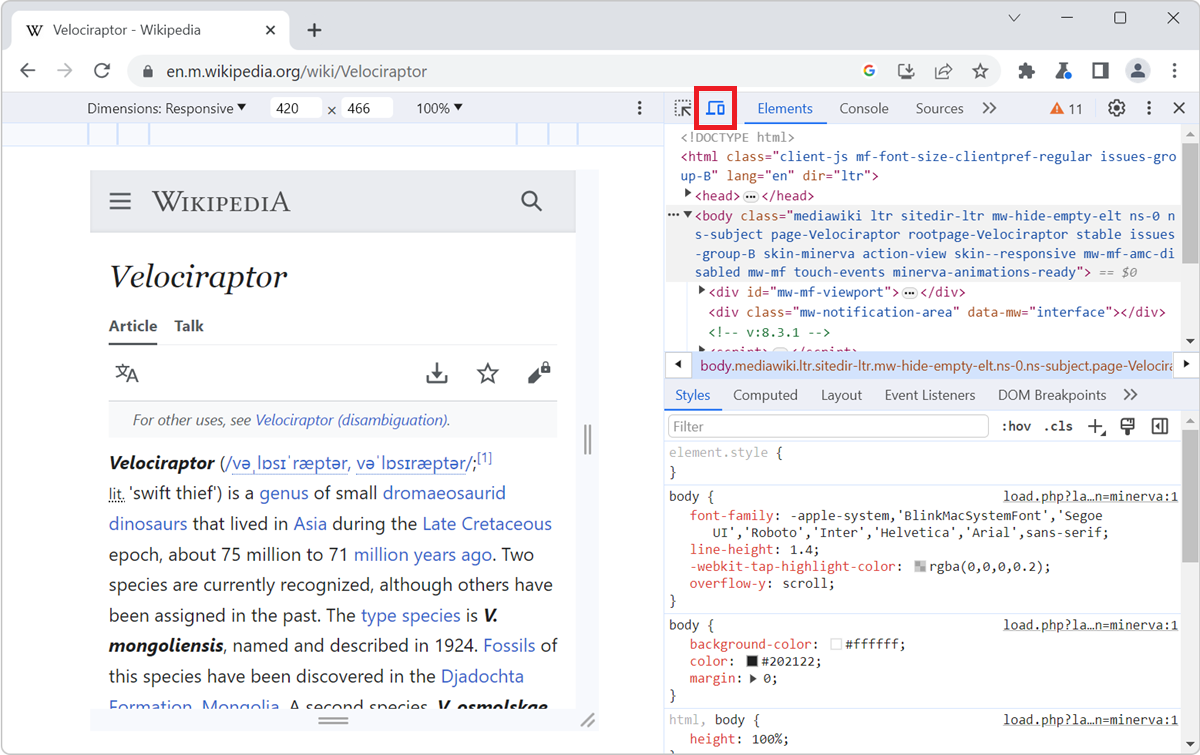 All browser DevTools have a built-in mode that you can use to test a webpage under different screen sizes and device capabilities. As a web developer, it is very important to realize that your website... Read more
 -
Ignore JavaScript code to ease debugging
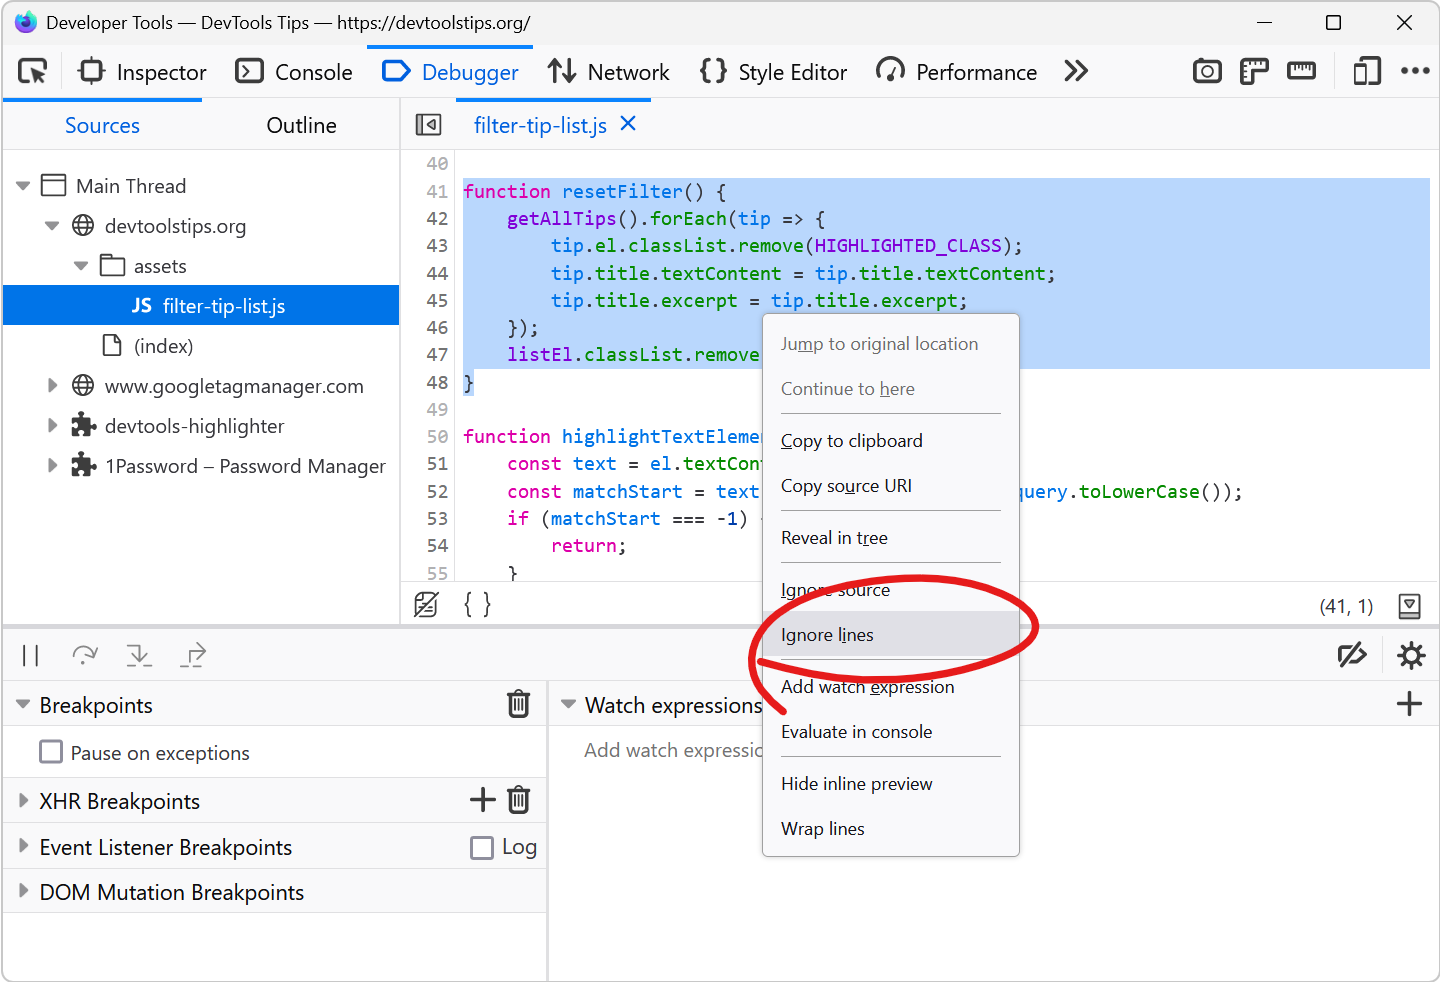 Debugging JavaScript can quickly get out of hand when you have a lot of code and many functions that call each other. What's even worse is when a lot of this code isn't even yours. This can happen whe... Read more
 edge
edge
 chrome
 firefox
 safari
 polypane