183 DevTools Tips
-
Visualize the screen reader order for elements within the page
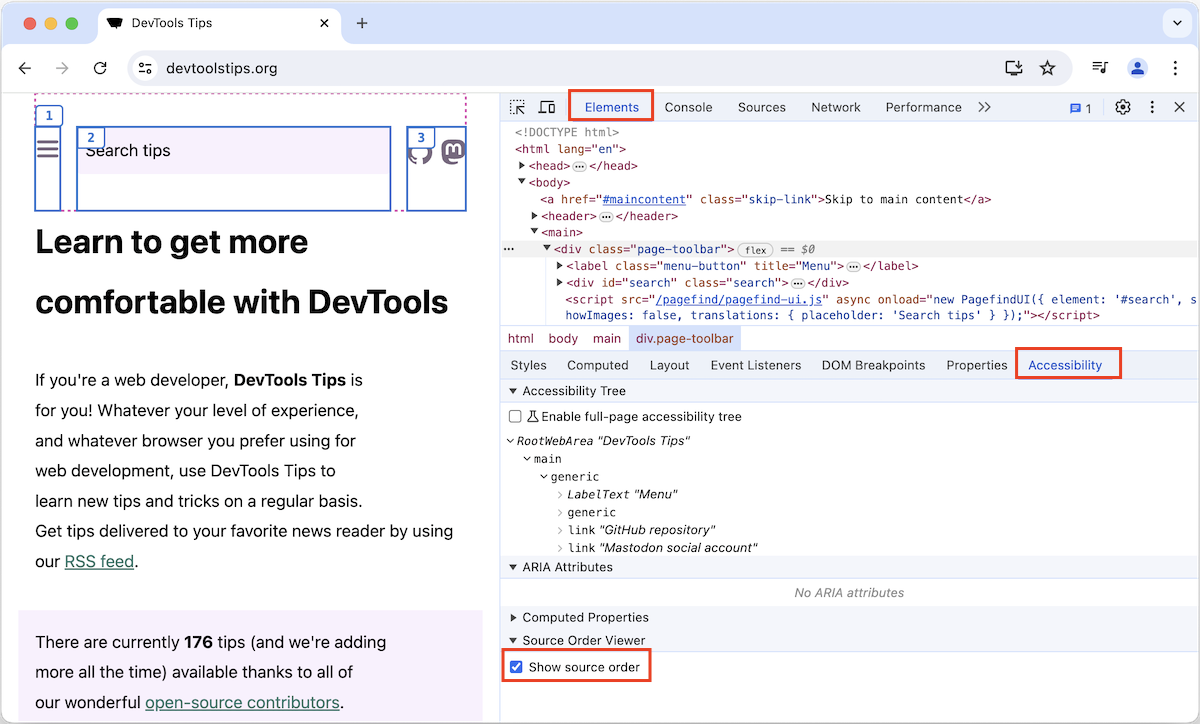 Some users make use of assistive technology, like screen readers (e.g. Narrator, VoiceOver, NVDA), to consume the content of web pages and interact with them. If a screen reader presents the content i... Read more
 -
Block resources to test your site without CSS or JavaScript
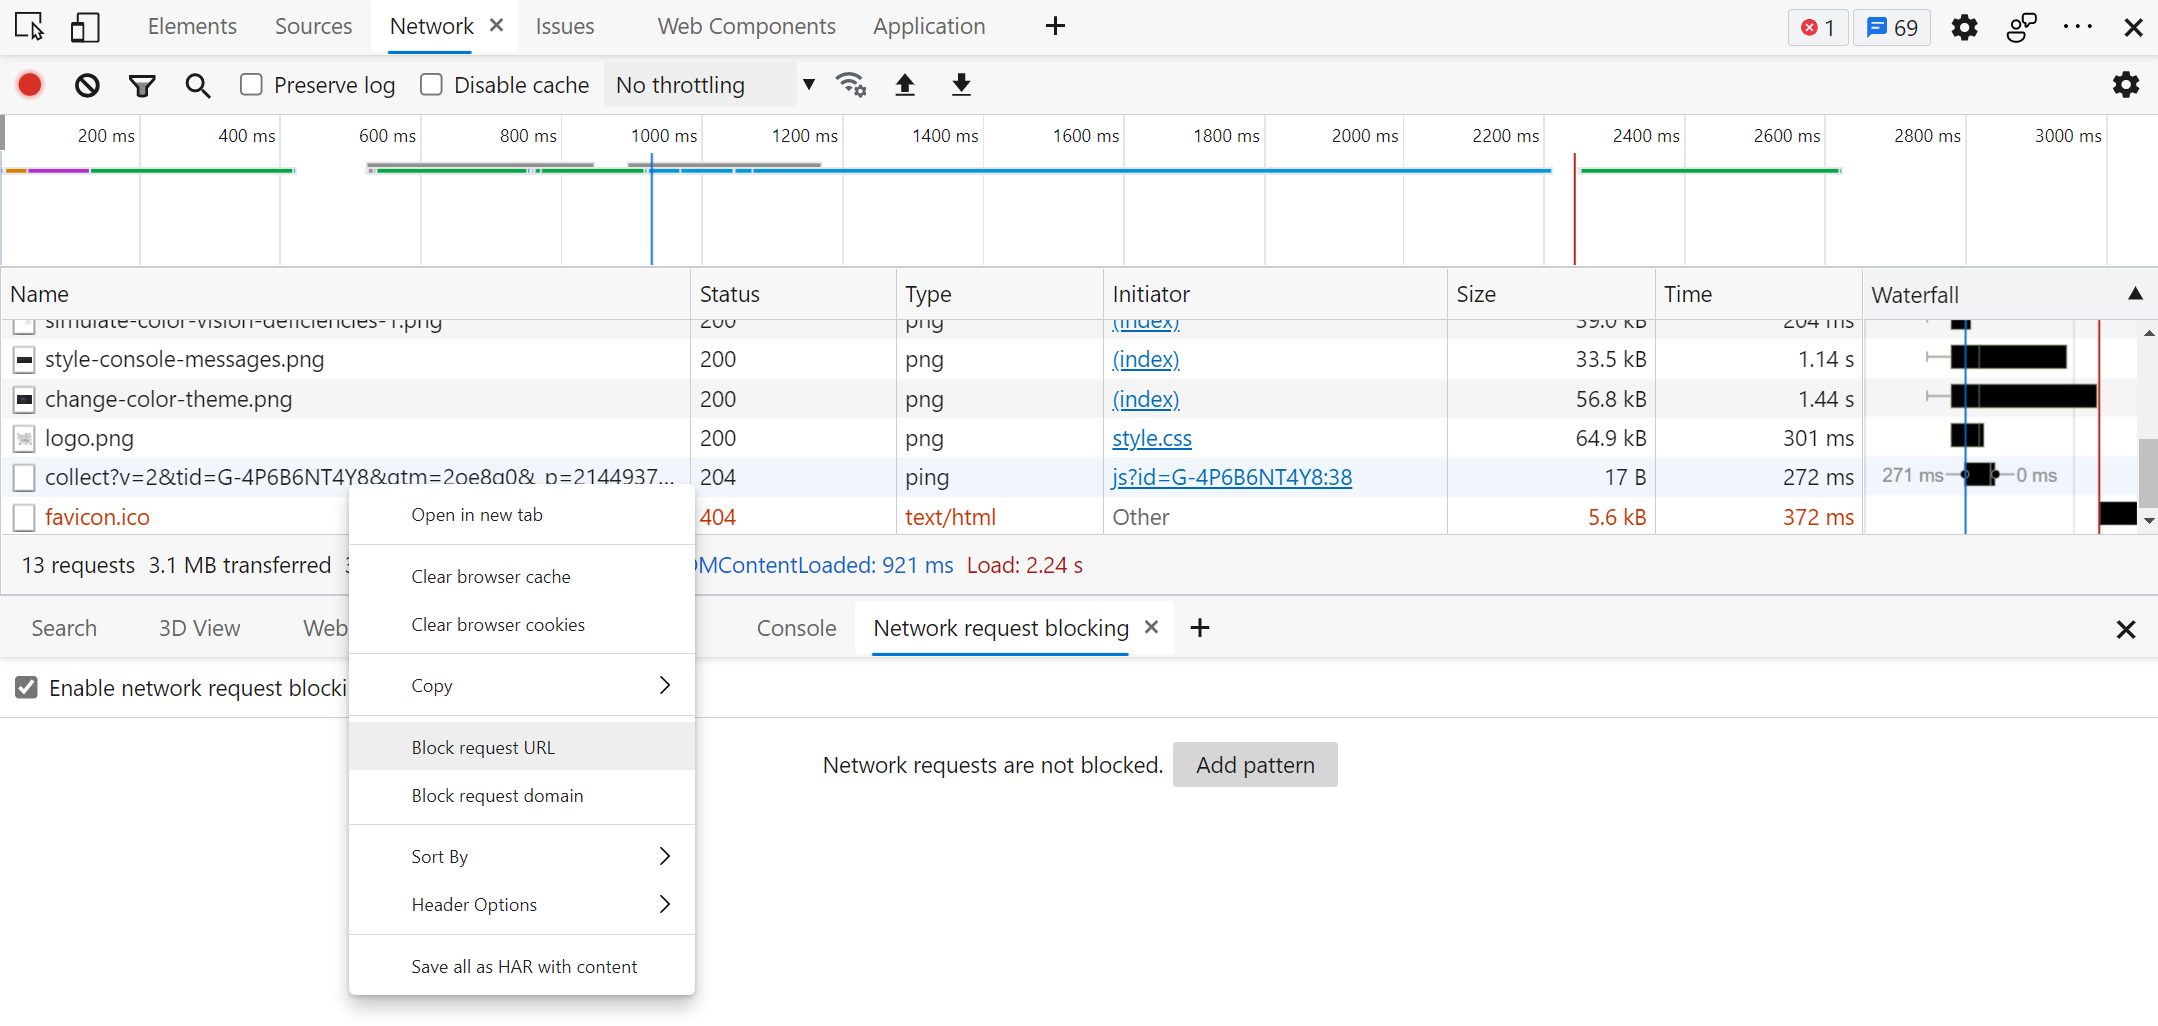 The various resources loaded by your site aren't always guaranteed to reach your users when they visit your site. Network problems can occur, JavaScript may be disabled, a CDN may be down, or the brow... Read more
 -
Prototype content changes with designMode
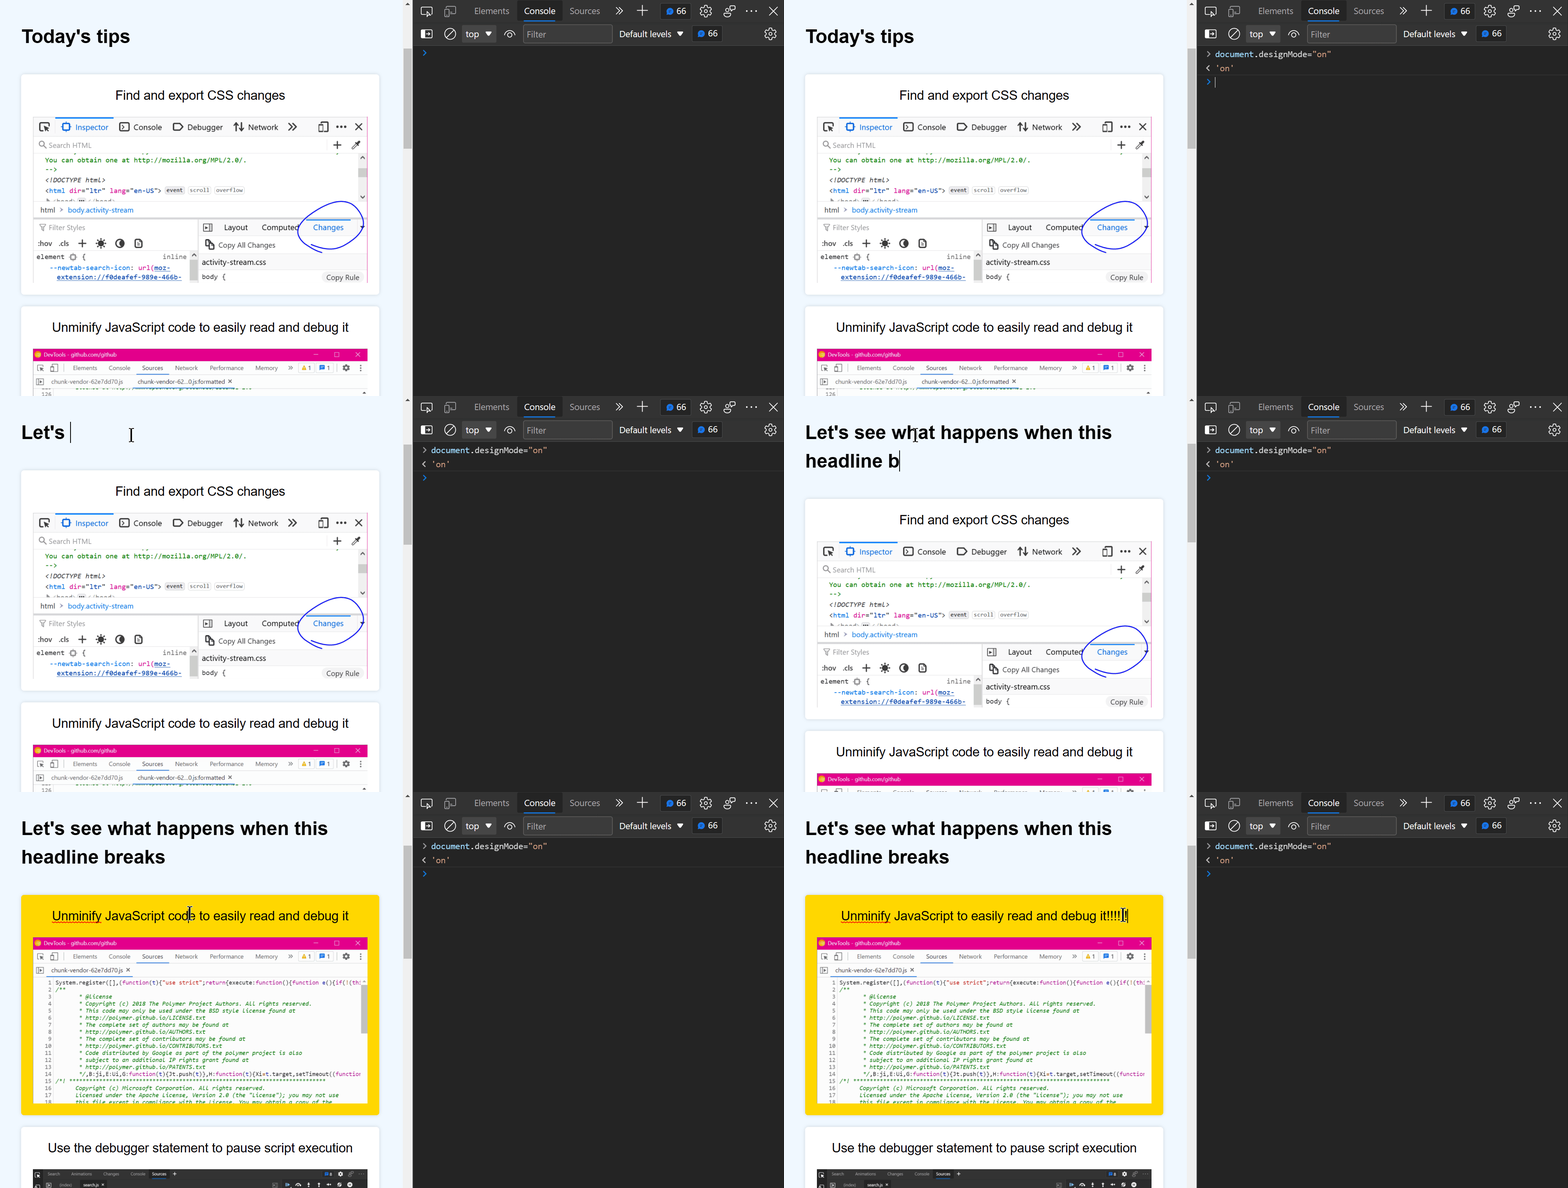 When creating or modifying a design prototype for the web, you may want to quickly edit content in the browser without having to find the relevant code. When you turn on designMode for the document or... Read more
 -
Capture node creation stack traces
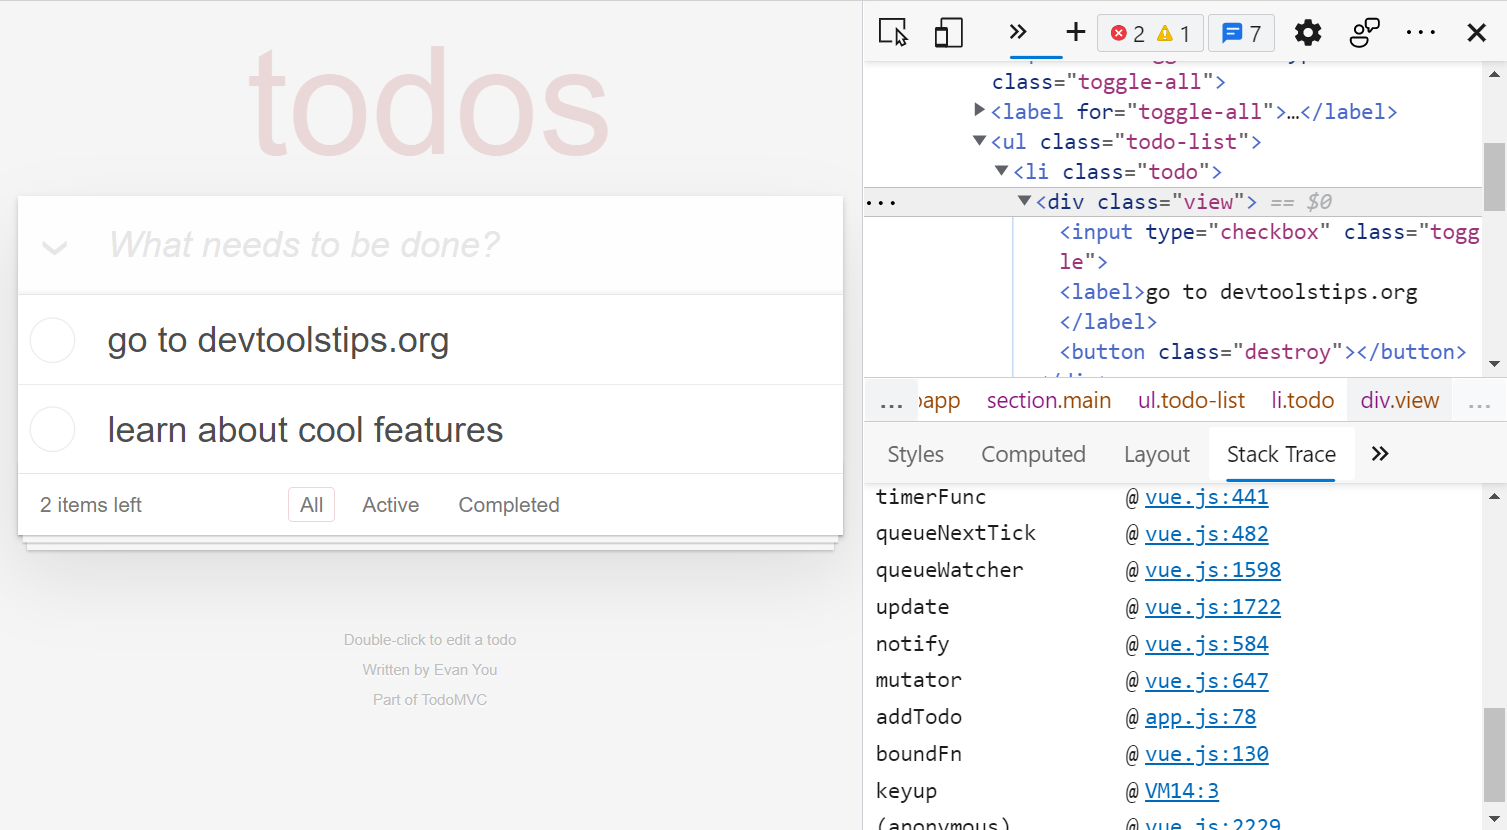 Have you ever wanted to know what caused a specific DOM node or element to be created in the page? When working on a site that uses a lot of JavaScript and especially when you don't know the codebase,... Read more
 -
Throttle the network speed to test your website on slower connections
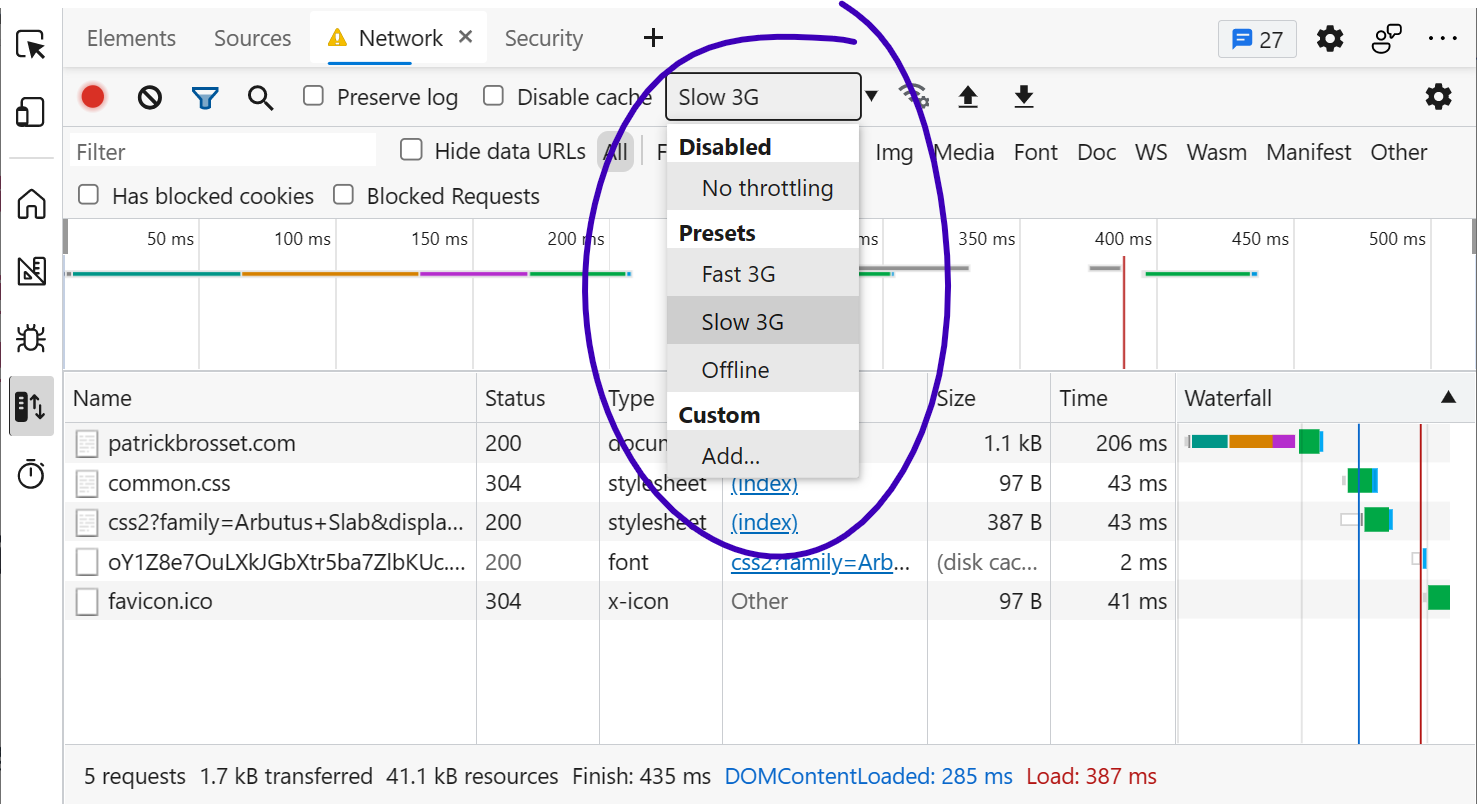 While you may develop your website on a fast network connection at home or at work, your users may not be able to use it with an equally fast connection. Perhaps they're in a moving car, or on the sub... Read more
 -
Edit CSS absolute and relative positions by dragging points in the page
 Firefox features a position editor that lets you move elements in the page by drag and drop. This works with elements that are positioned in CSS with position:relative or position:absolute and that ha... Read moreCategories: Supported by:
 -
Copy an element's XPath expression
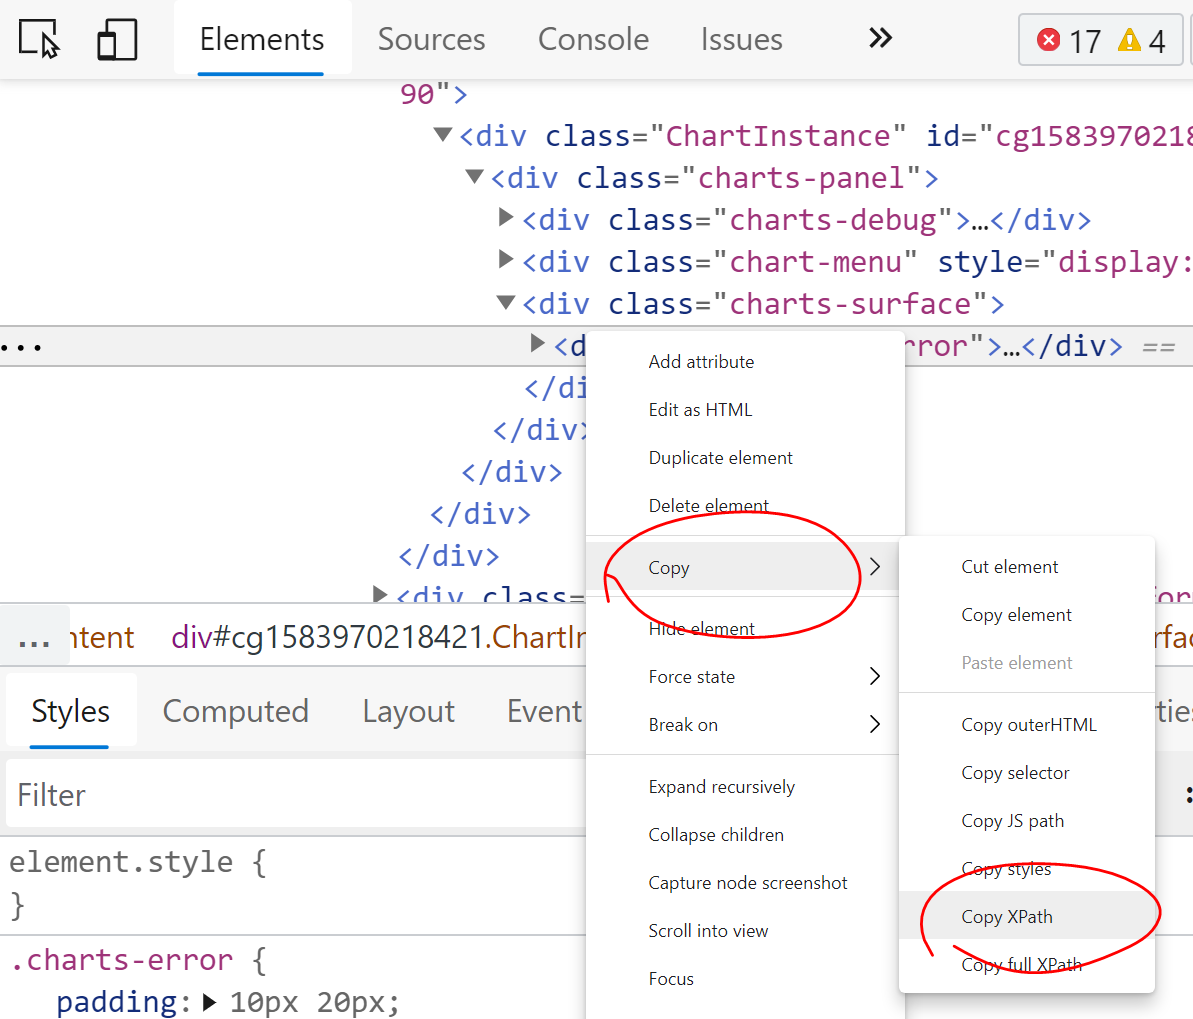 You can easily copy an element's XPath expression from DevTools. This is useful if you need this expression for an automated test for example. Go to the Elements (or Inspector) panel Use the context-... Read more
 -
Convert font property units
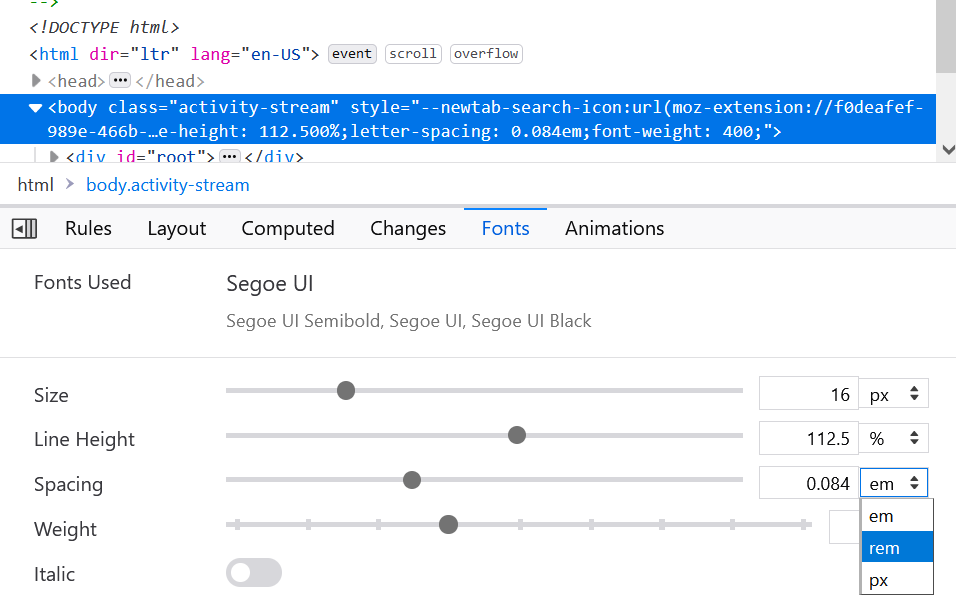 Font CSS properties such as font-size, line-height or letter-spacing can be expressed in multiple different length units (like many other CSS properties). Firefox, Chrome and Edge allow you to convert... Read more
 -
Find DevTools reference documentation
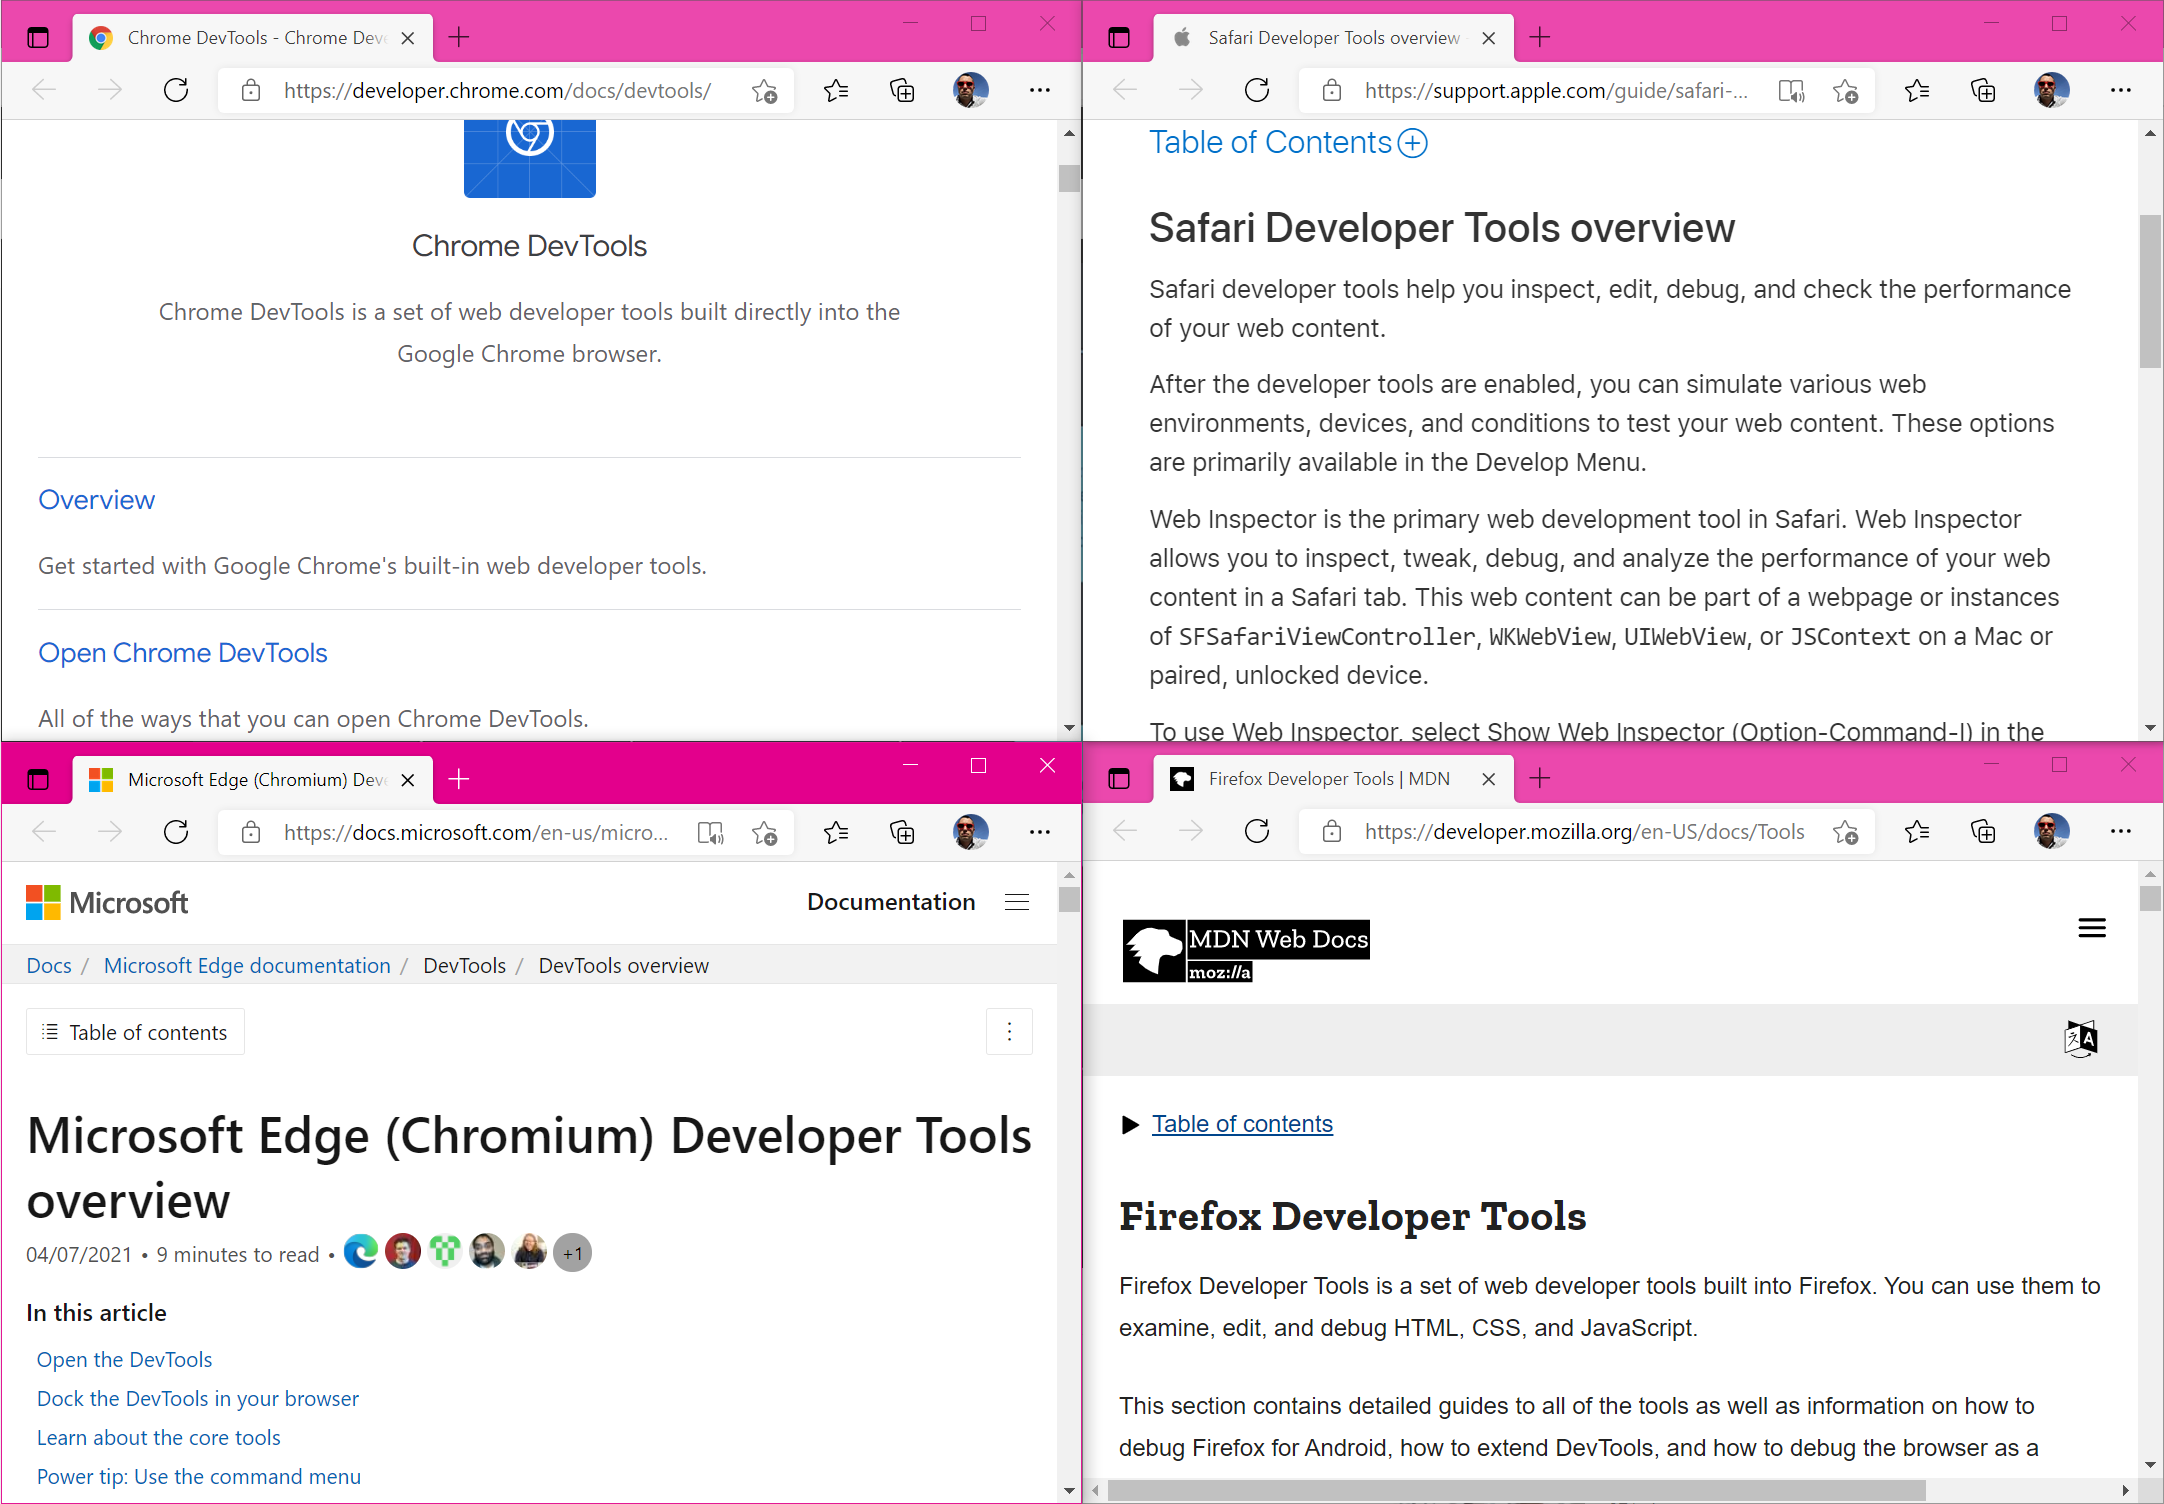 If you want to learn more about what other tools exist in a browser, or what features a given tool provides, you can find reference documentation from all the major browsers here: Firefox Developer T... Read more
 -
Drag and drop nodes in the DOM tree
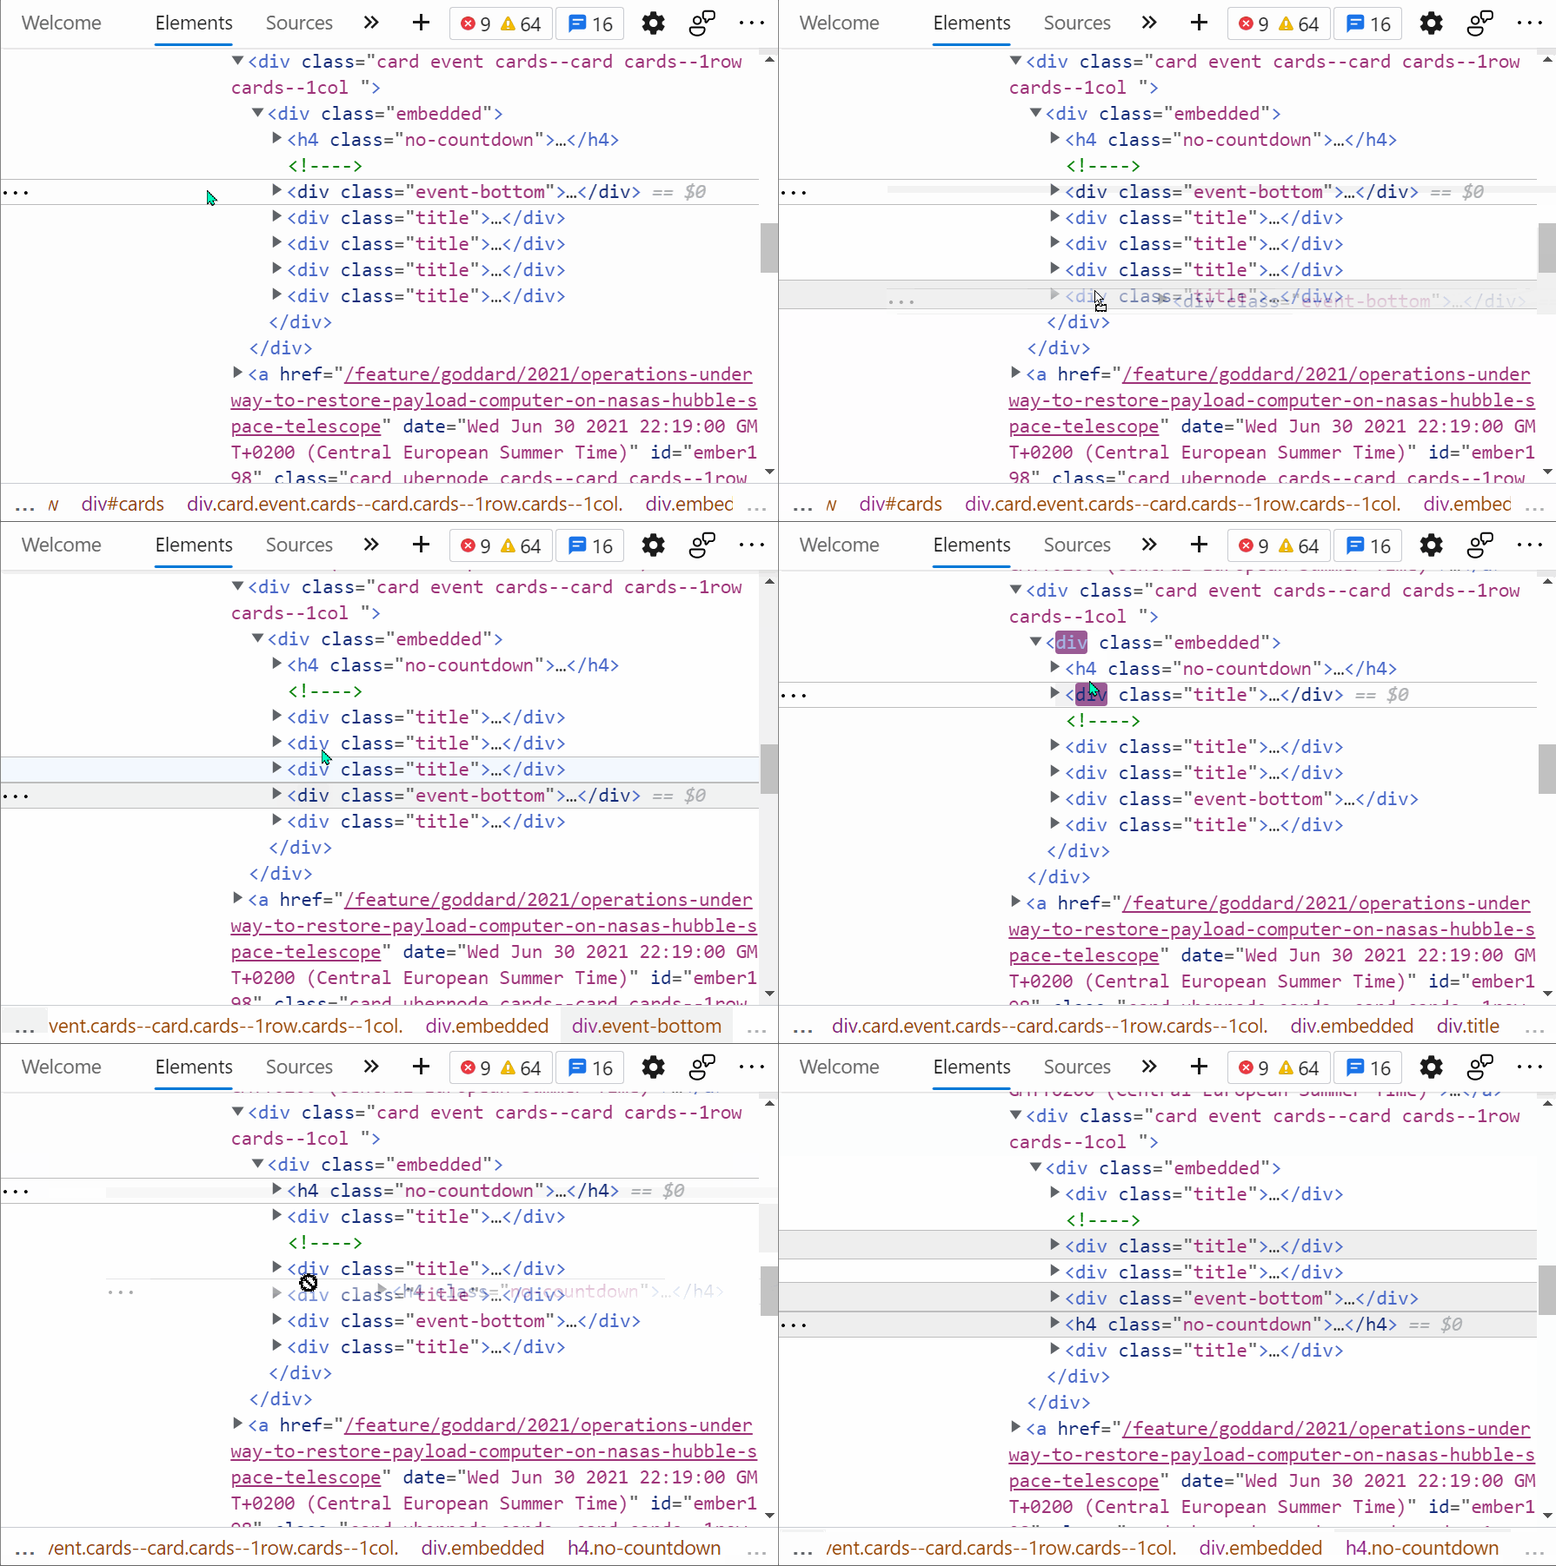 If you need to move nodes or elements around in the DOM tree, to re-order things in the page, you can do it by drag and dropping nodes around in the Elements (or Inspector) panel.... Read more
 -
Event listeners are suppressed when paused
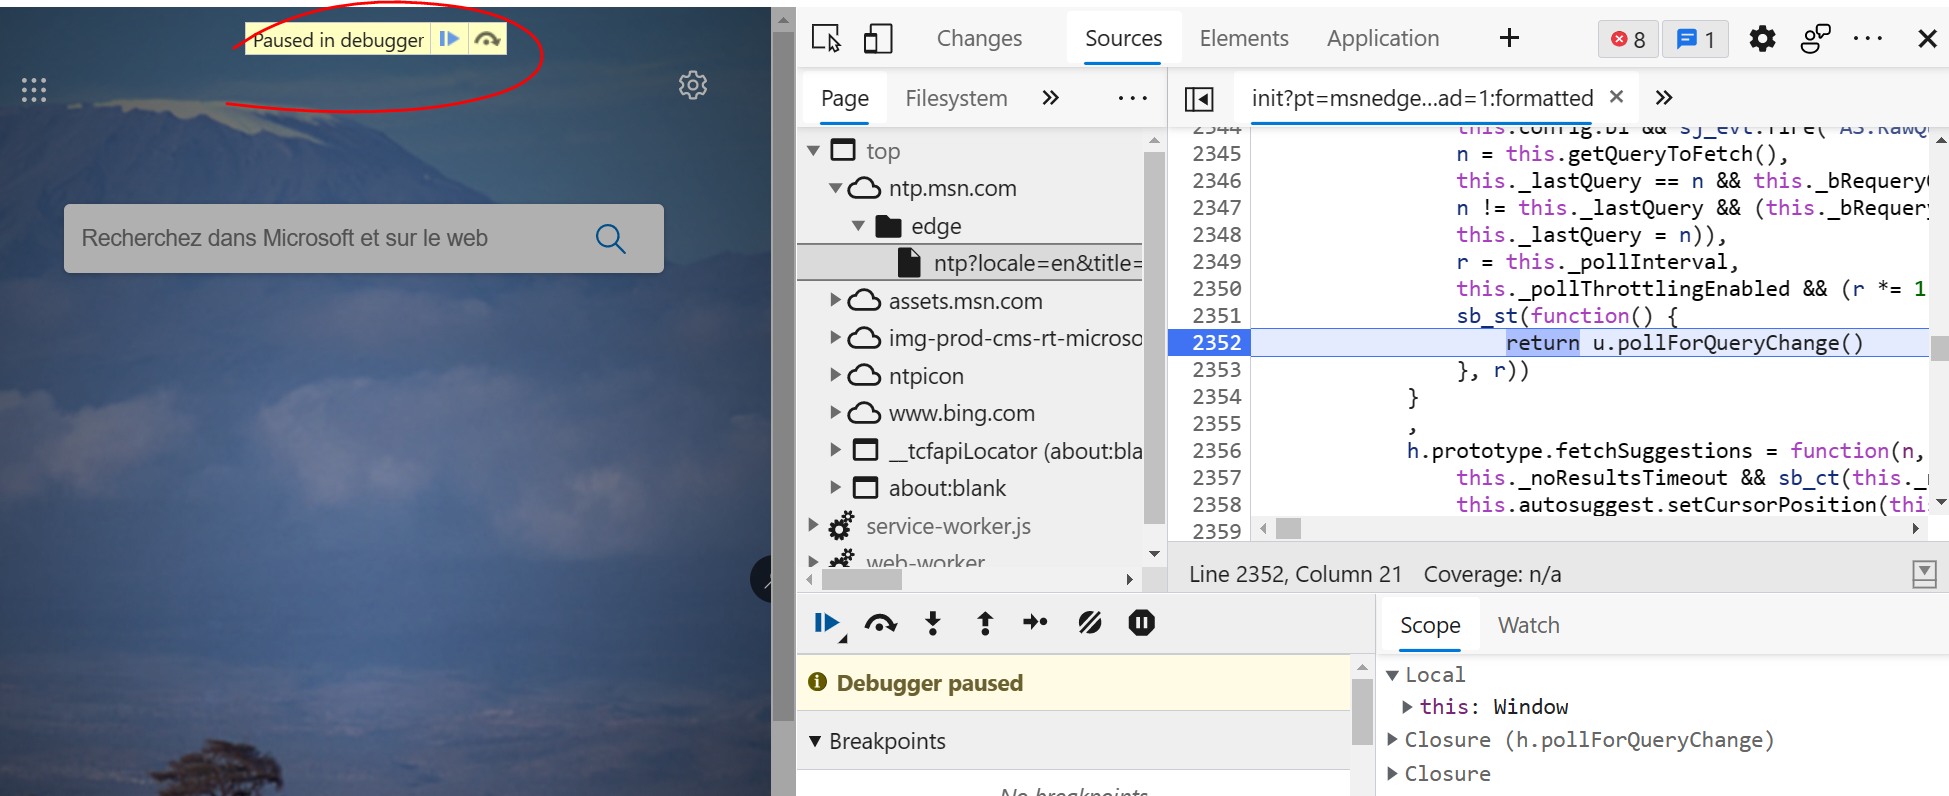 This is not really a tip, but rather an interesting thing to be aware of when debugging JavaScript. If you use breakpoints in the Sources (or Debugger) tab in DevTools to debug JavaScript, you should... Read more
 -
Sample colors from the page
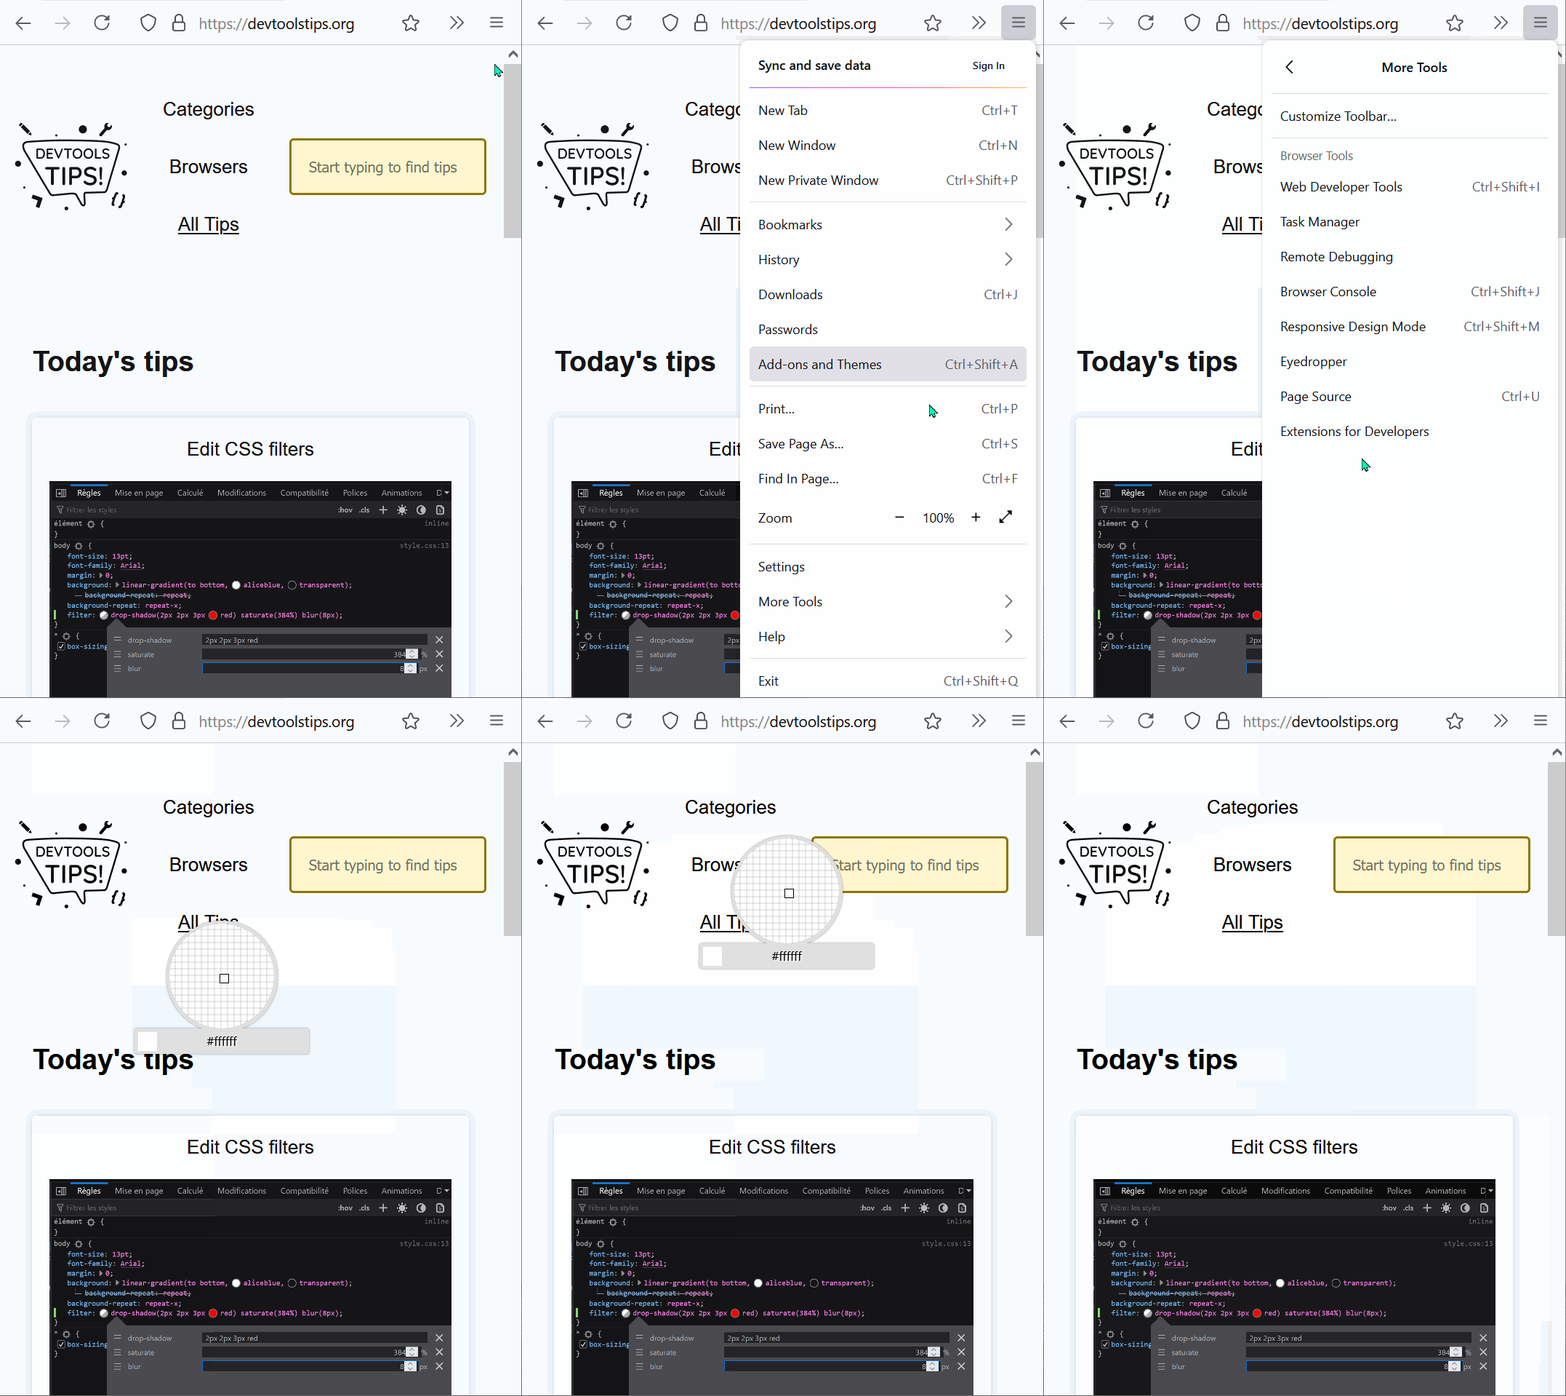 Being able to sample colors from the page is super useful. Firefox, Edge and Chrome all allow you to do this in 2 different ways: In Firefox it's really simple and doesn't even require opening DevToo... Read more
 -
Visualize the tabbing order on the page
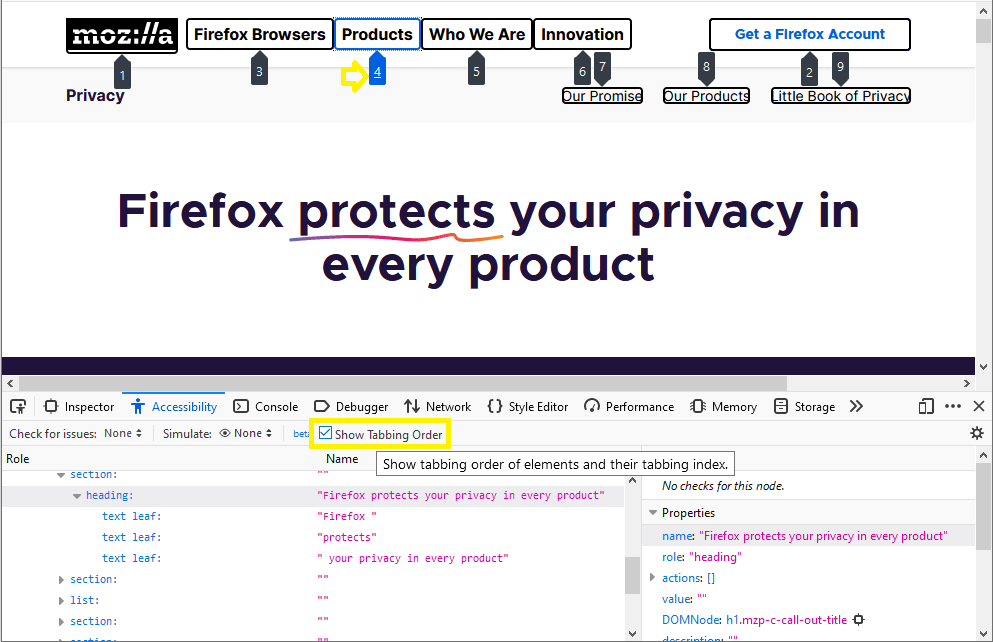 Users who do not or can't use a mouse or trackpad can use the tab key to navigate through focusable elements on the page. If the order in which those elements get focused is incorrect, this might give... Read more
 -
Apply CSS styles to console messages
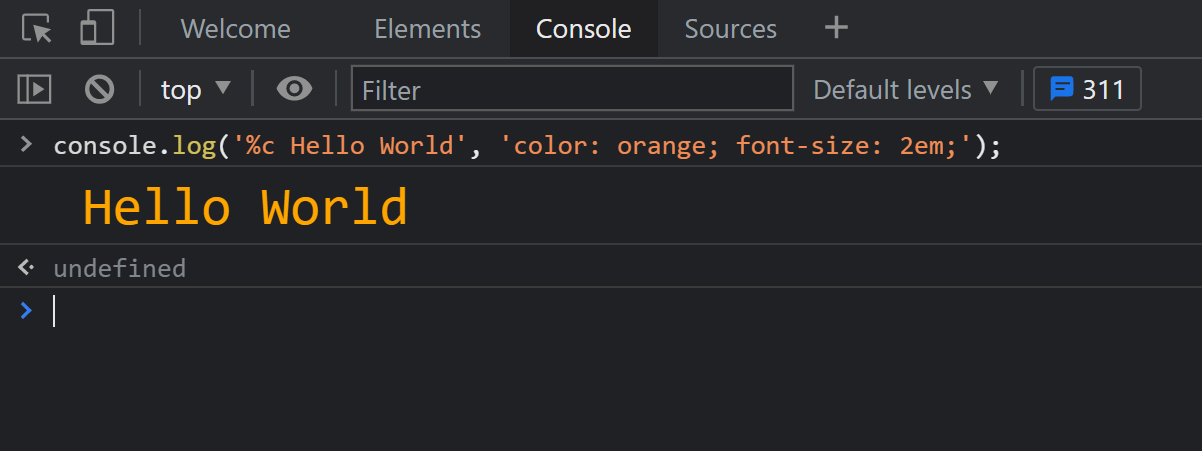 The console.log output can be styled in DevTools using CSS. console.log('%c Hello World', 'color: orange; font-size: 2em;');... Read more
 -
Find all images without alternative text
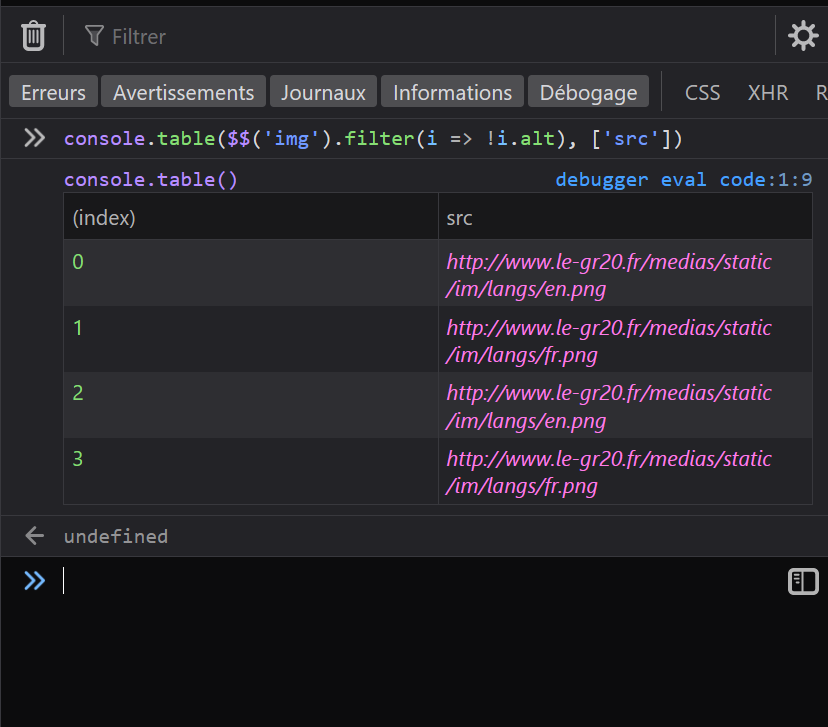 With HTML, you can add alternative text to images using the alt attribute. It can be used to add a text description to images, which is extremely useful for accessibility as some people may not be abl... Read more
 -
Draw a box around all elements to debug your CSS and page structure
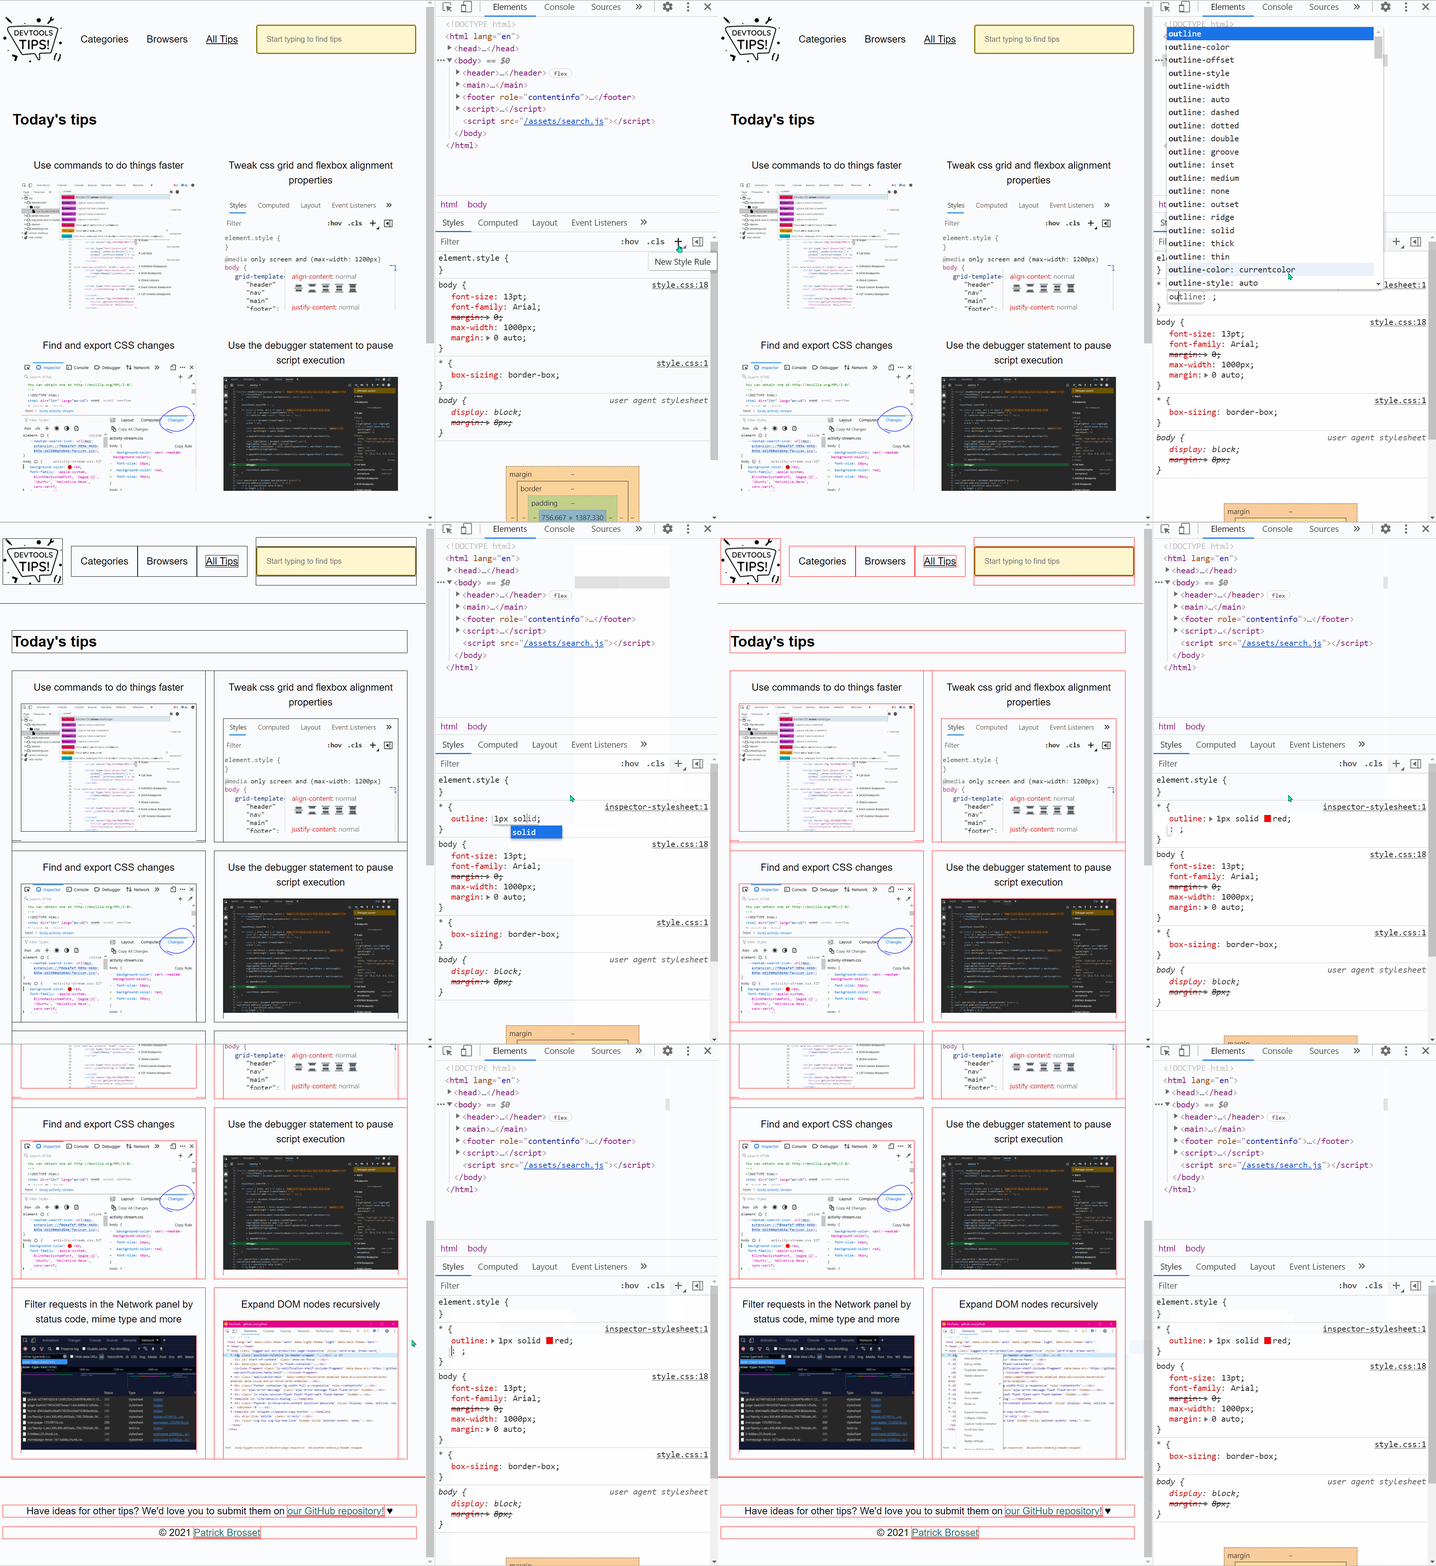 Simple, yet powerful, * { outline: 1px solid red; } is a useful debugging trick that helps understanding the page structure, finding overflow bugs or understand why elements are being pushed away for... Read more
 -
Find DOM elements from the console
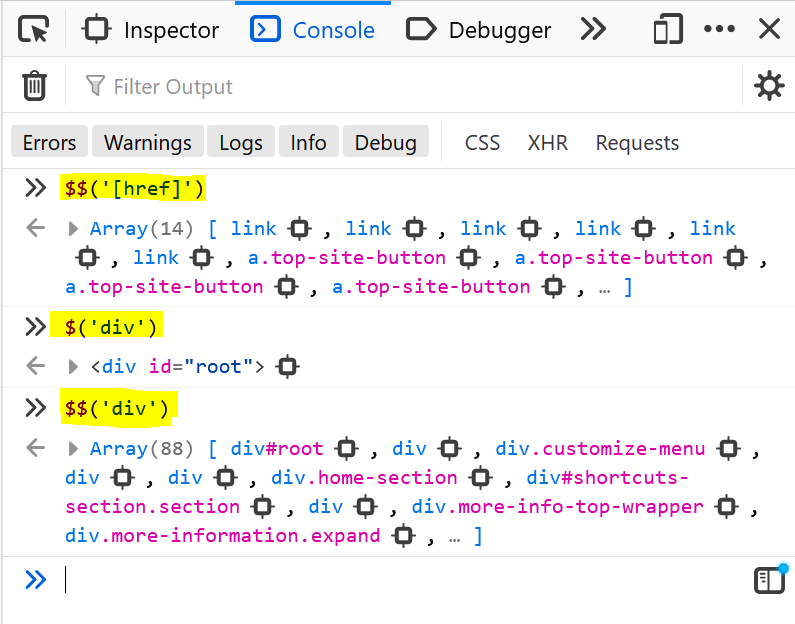 $ and $$ are 2 functions you can use in the console to find elements in the page. They are essentially shortcuts to the longer document.querySelector() and document.querySelectorAll() functions, but $... Read more
 -
Persist console messages across page navigations and reloads
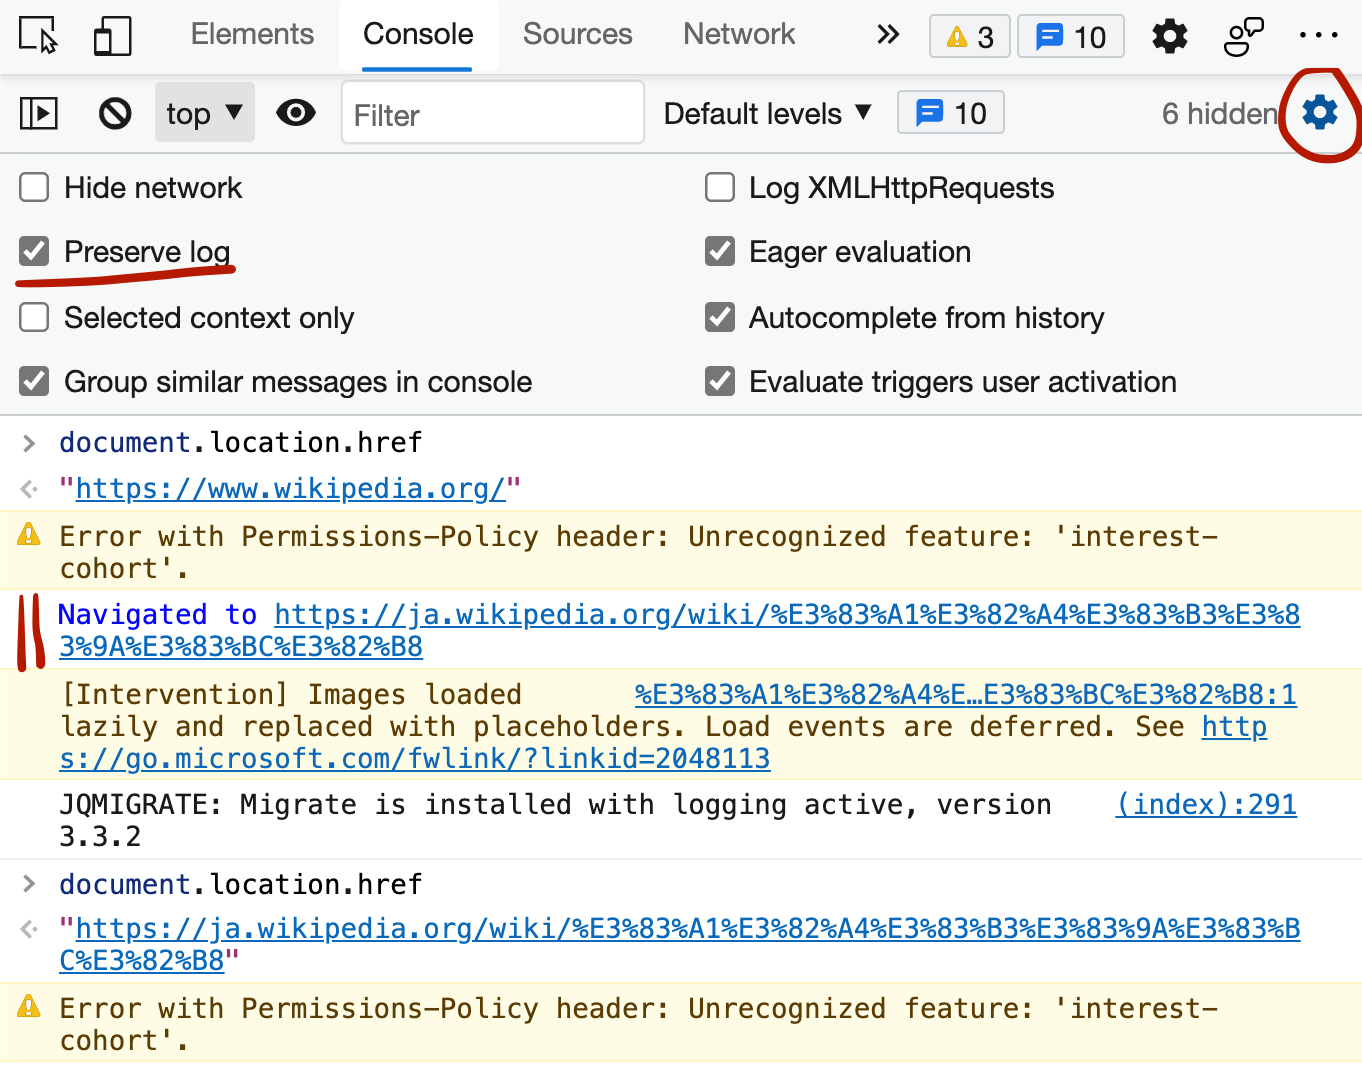 By default, the messages displayed in the console get removed as soon as you refresh the page (or navigate to a new page). If you want to keep those messages as long as DevTools is open, follow these... Read more
 -
Simulate color vision deficiencies
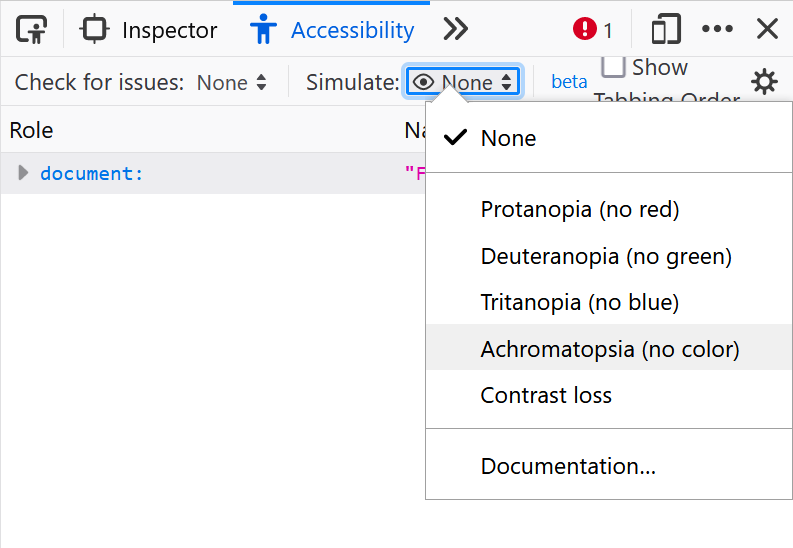 People who visit your web pages may have different types of color vision deficiencies that, if you incorrectly use colors for meaning, may affect their experience. Firefox, Chrome, Polypane and Edge m... Read more
 -
Edit CSS angles
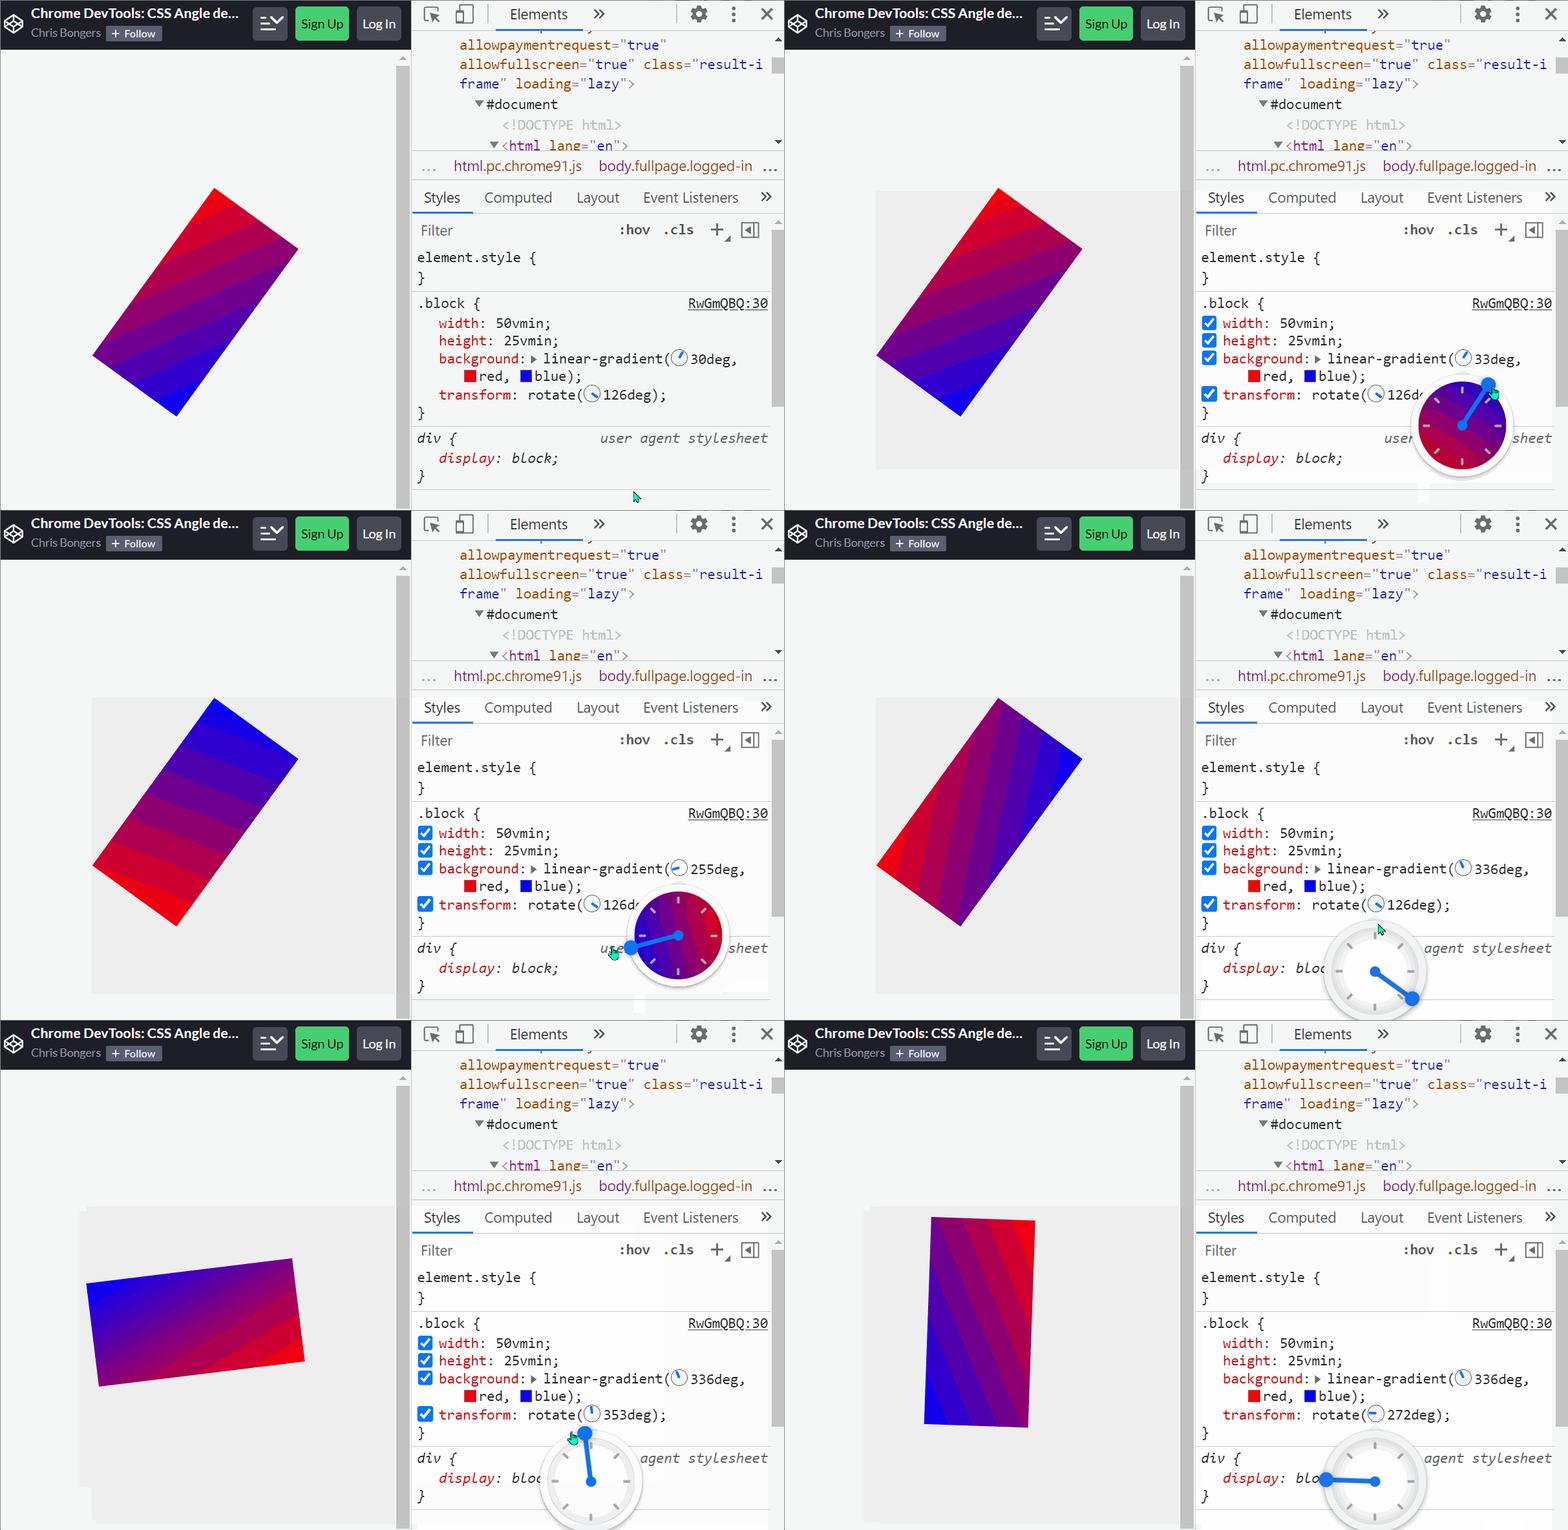 In CSS, several different properties use angle unit values, such as the rotate() function of a transform or the linear-gradient orientation of a background-image, and more. In Chrome and Edge, whereve... Read more
 -
Edit clip-path and shape-outside CSS properties by dragging points in the page
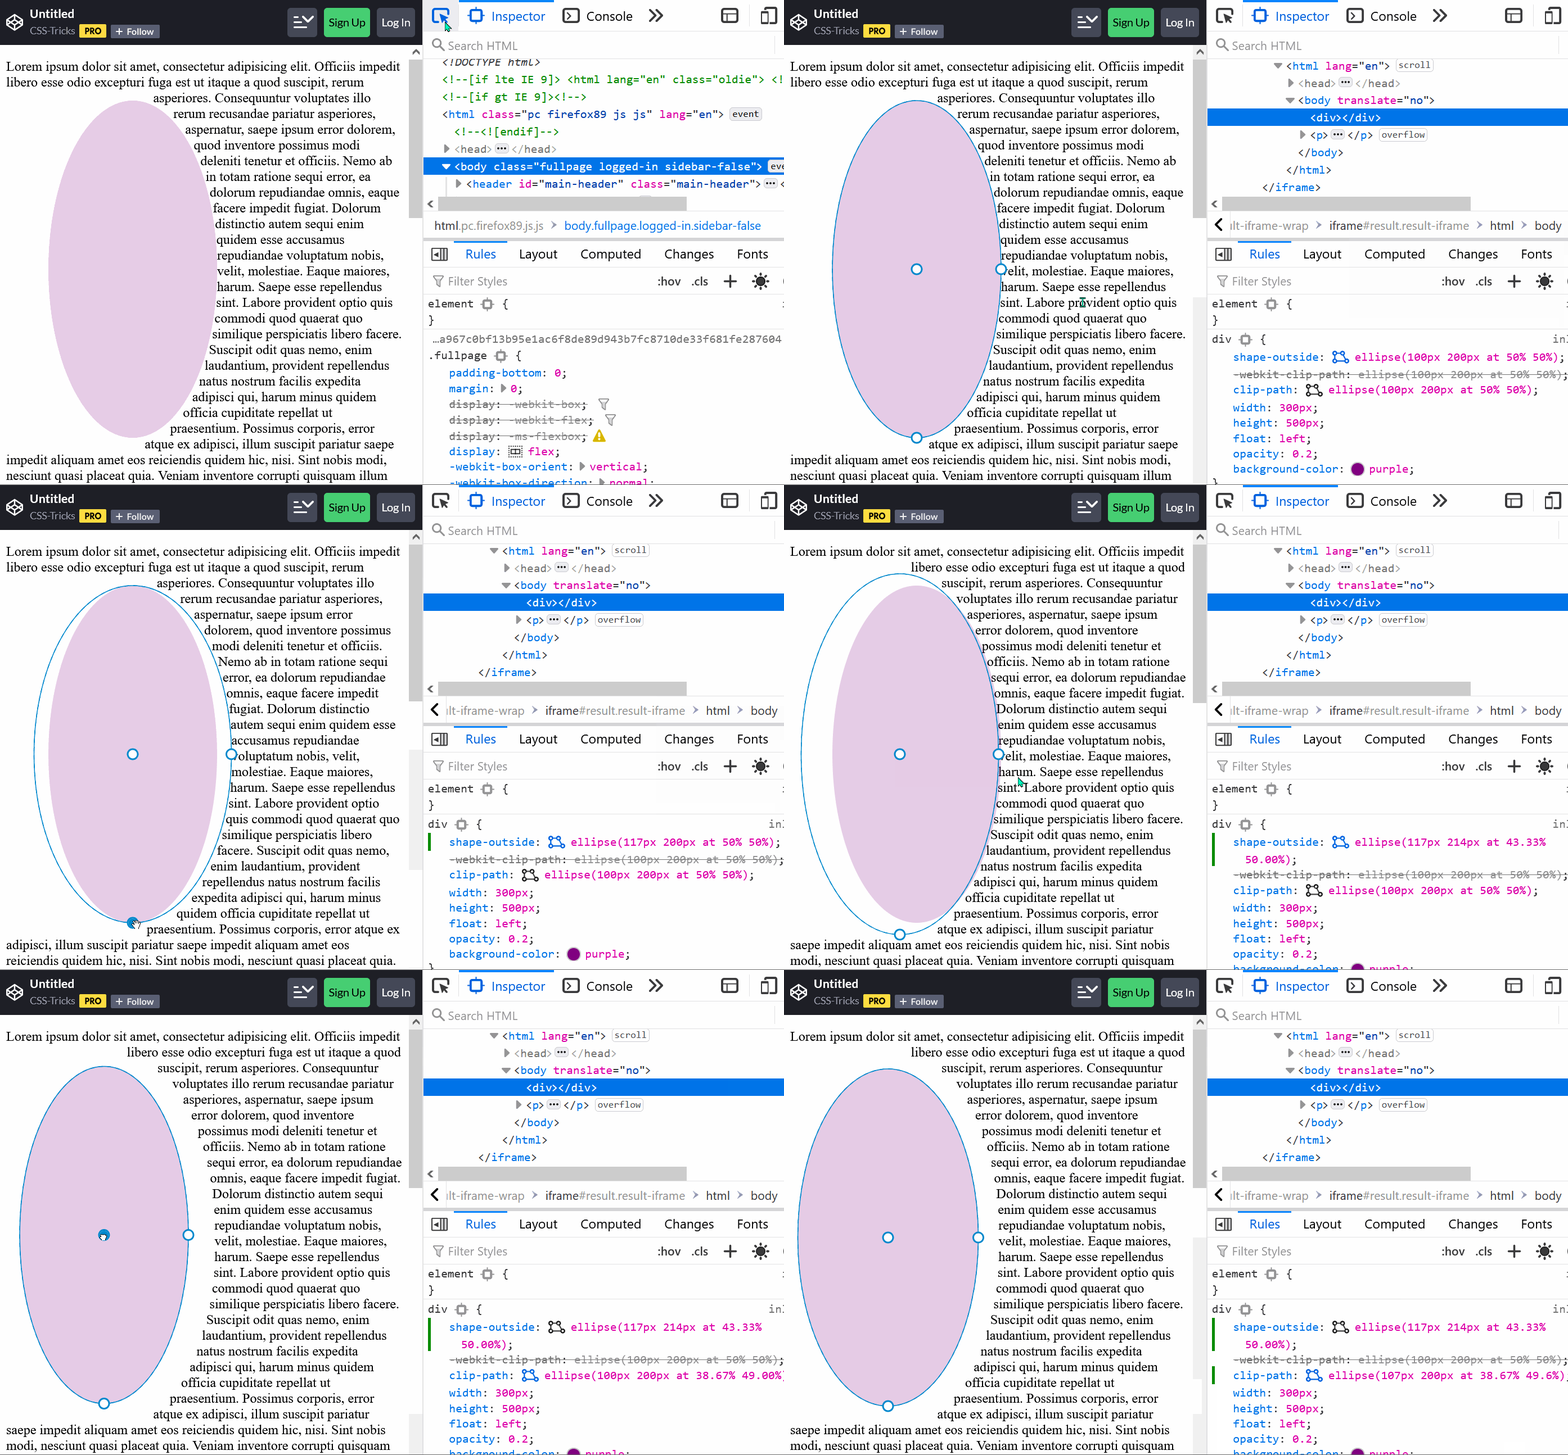 The clip-path property is a great way to change the final shape of an element and give it the shape that you want. You can use this property to make an element be a circle, an ellipse, a polygon or an... Read moreCategories: Supported by:
 -
Copy an object from the console
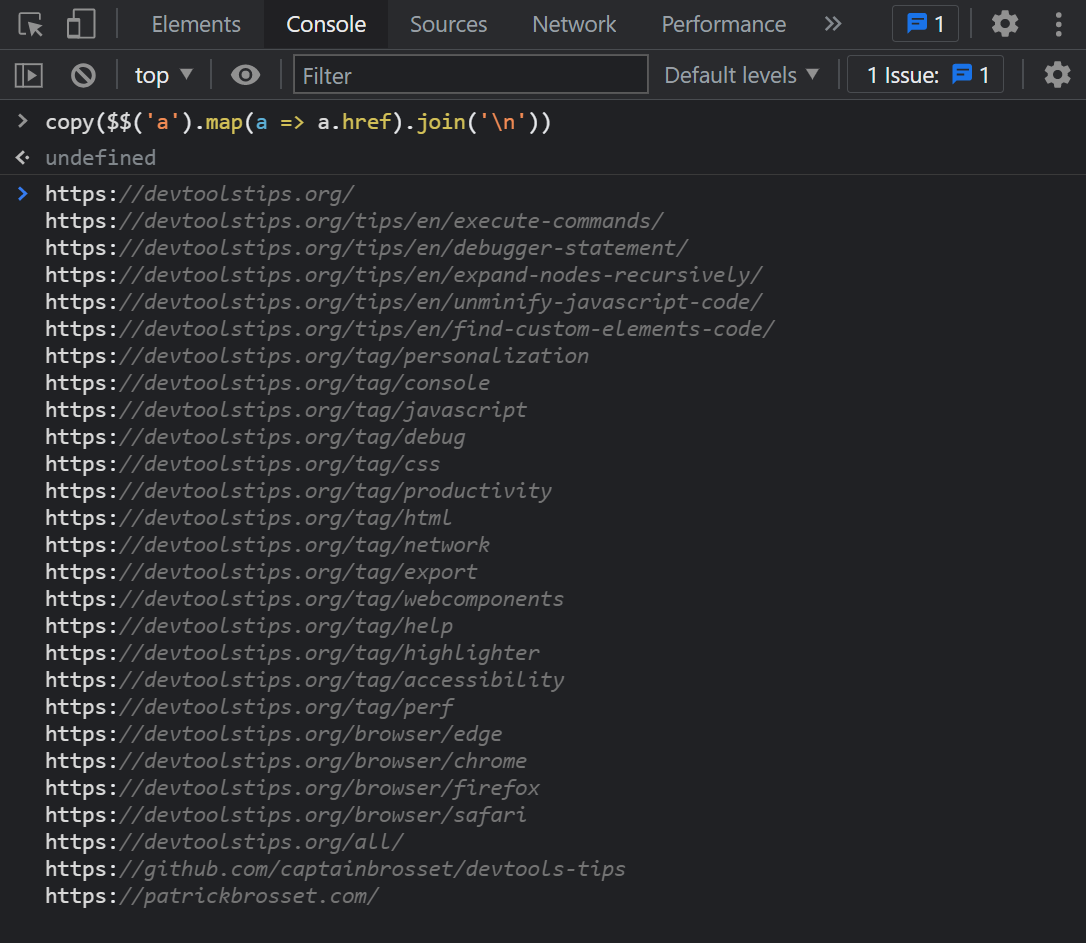 The console panel supports a very handy copy() function that stringifies and copies anything you pass to it as an argument, so you can then paste it somewhere else. For example: copy($$('a').map(a =&g... Read more
 -
Get the selected element in the console
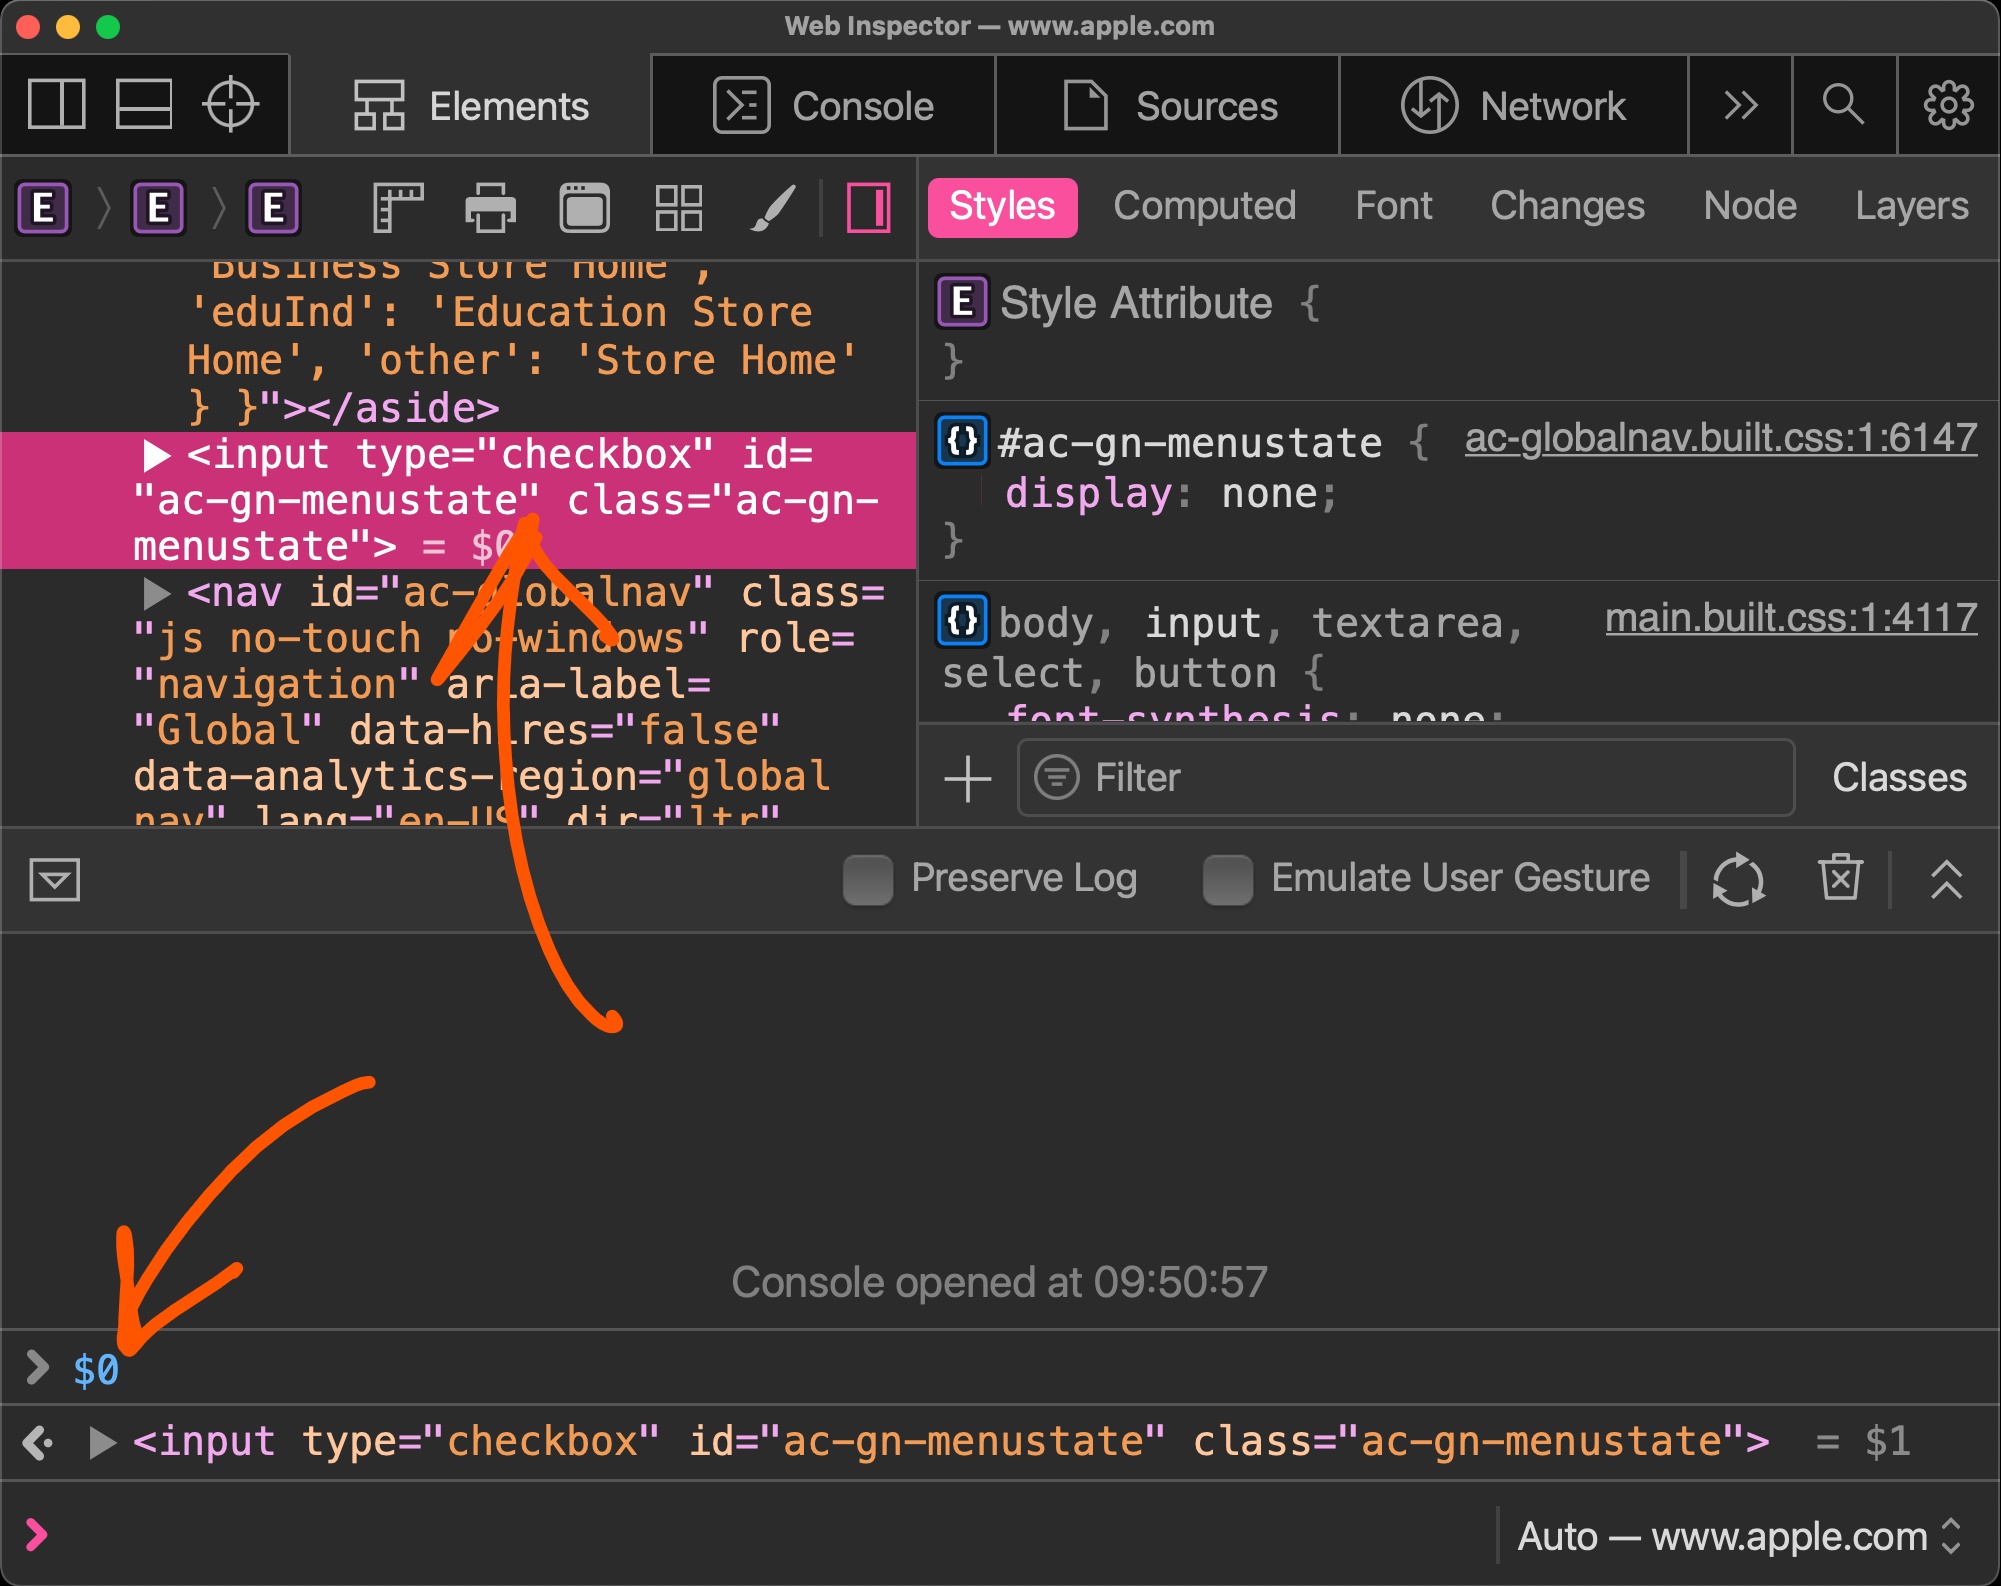 If you selected an element in the Elements panel (in Chrome, Safari, Polypane or Edge) or the Inspector panel (in Firefox), you can refer to it in the console using $0. This shortcut will return the D... Read more
 -
Find your web component's custom element code
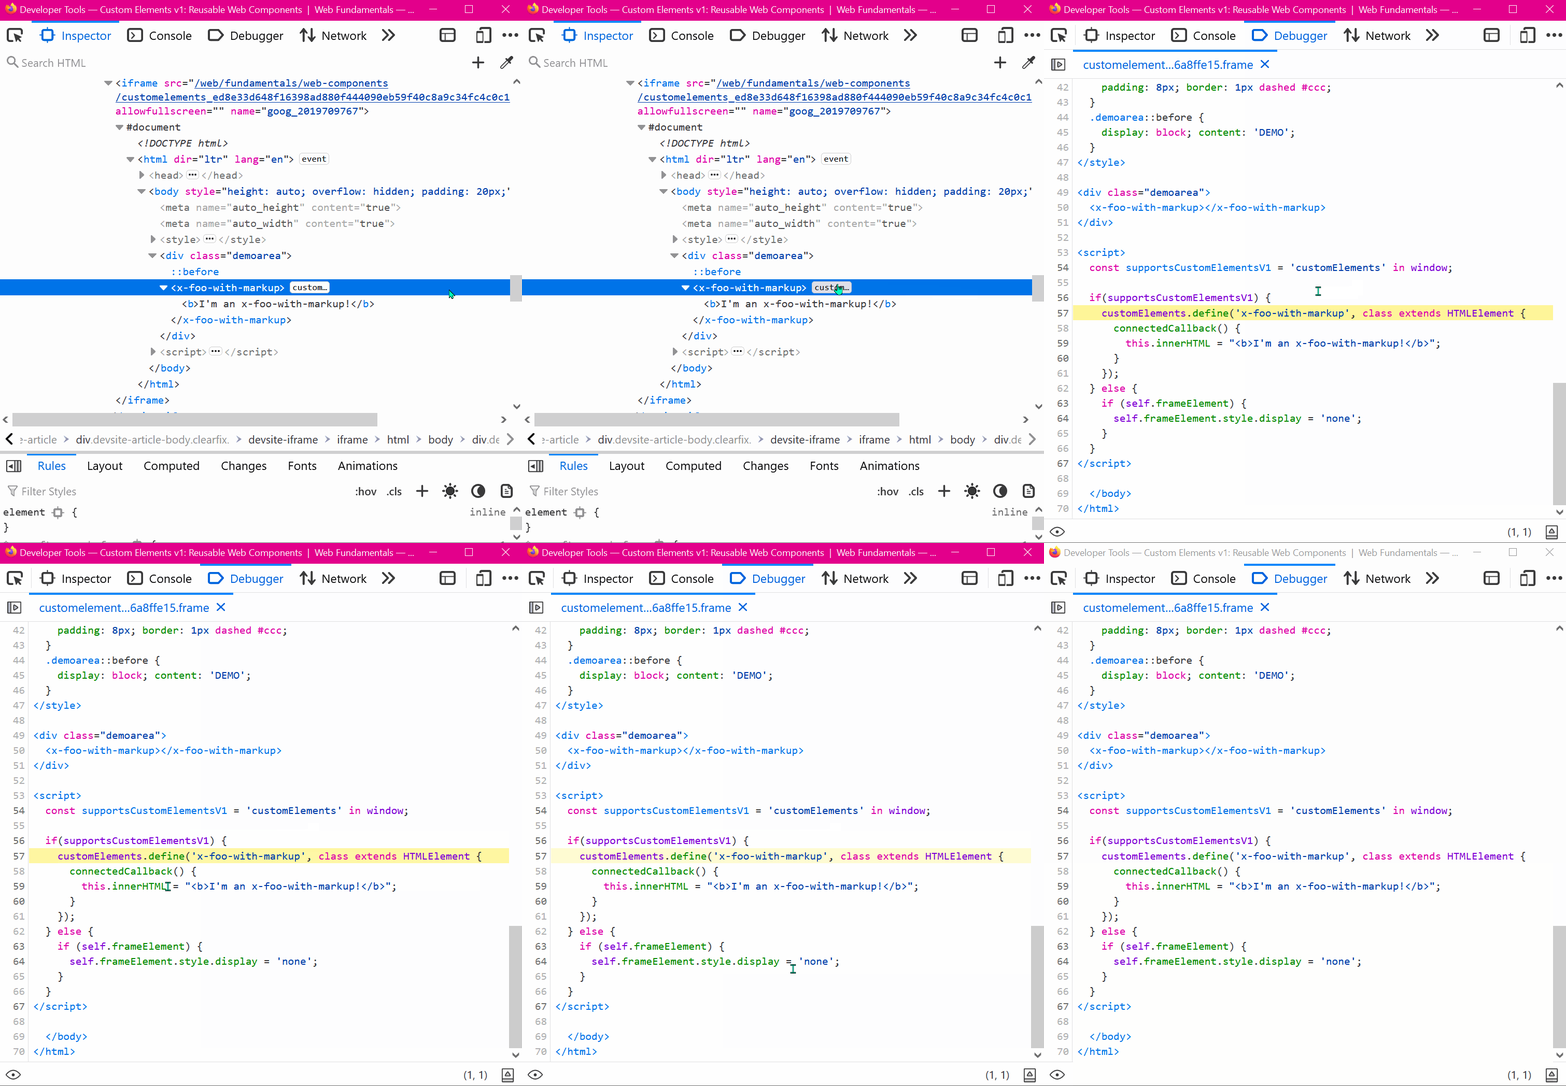 In Firefox, when inspecting elements (in the Inspector panel), you can click on the custom badge to go straight to the custom element's JavaScript source code.... Read moreCategories: Supported by:
 -
Tweak css grid and flexbox alignment properties
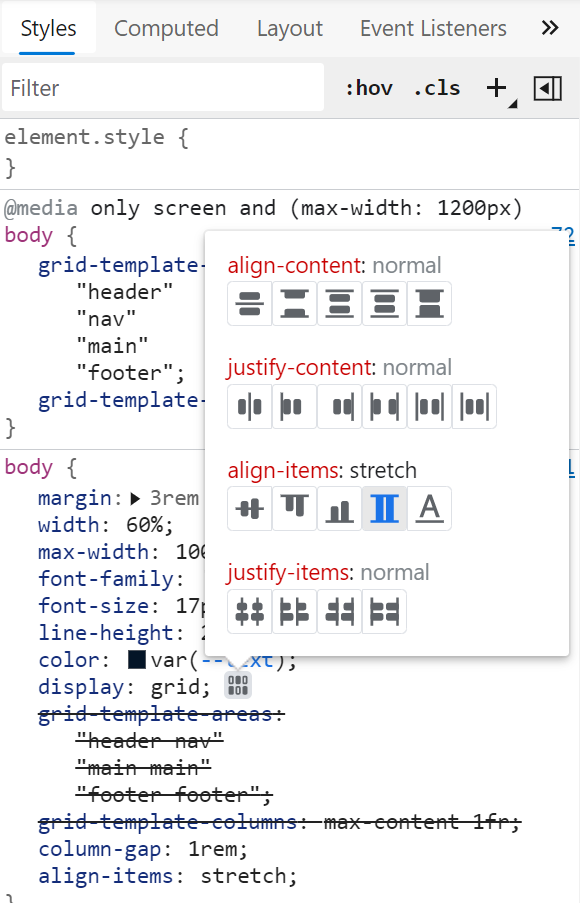 Chrome and Edge both have a visual editor useful for tweaking flexbox and grid alignment properties. Head over to the Elements panel Select an element that is either a grid or flexbox container In th... Read more