183 DevTools Tips
-
Override network responses with local files
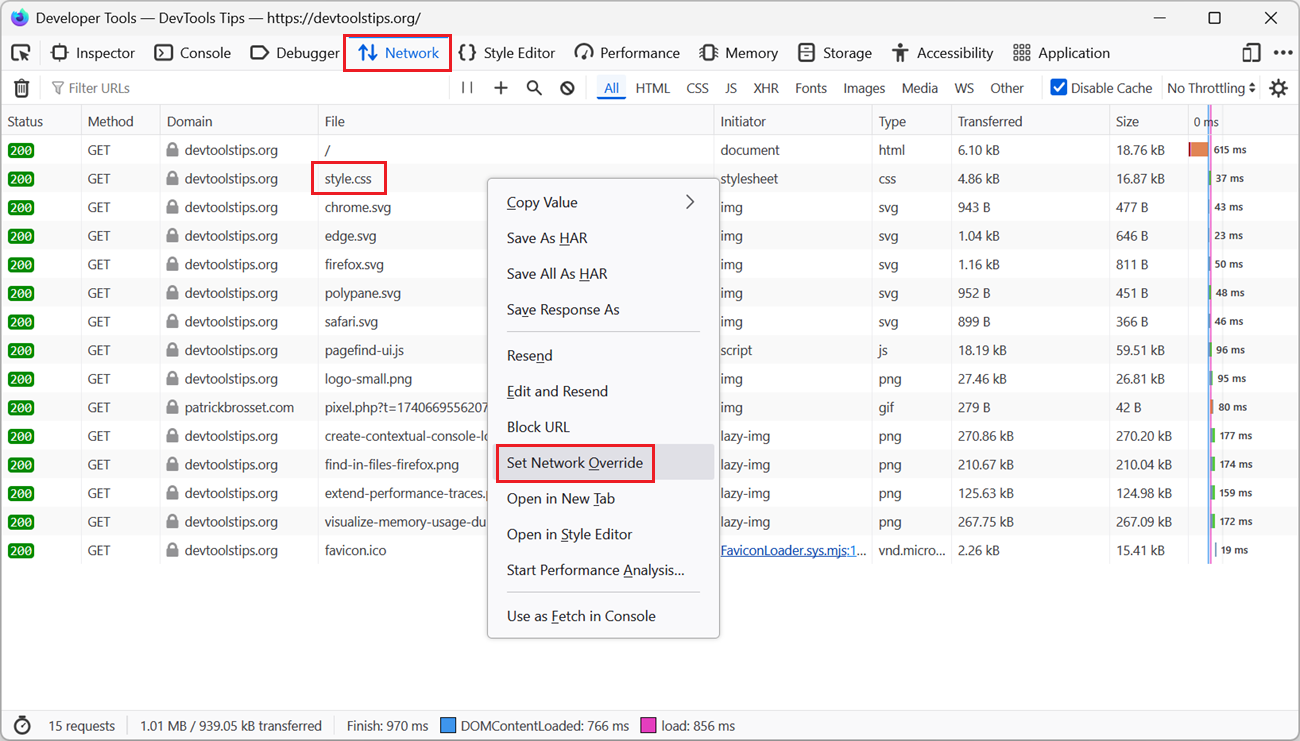 To test a quick fix locally, in DevTools, without editing the source file and deploying it to a server, override network responses with local files. Firefox # Open the Network tool. Find the reque... Read more
 -
Create contextual console loggers
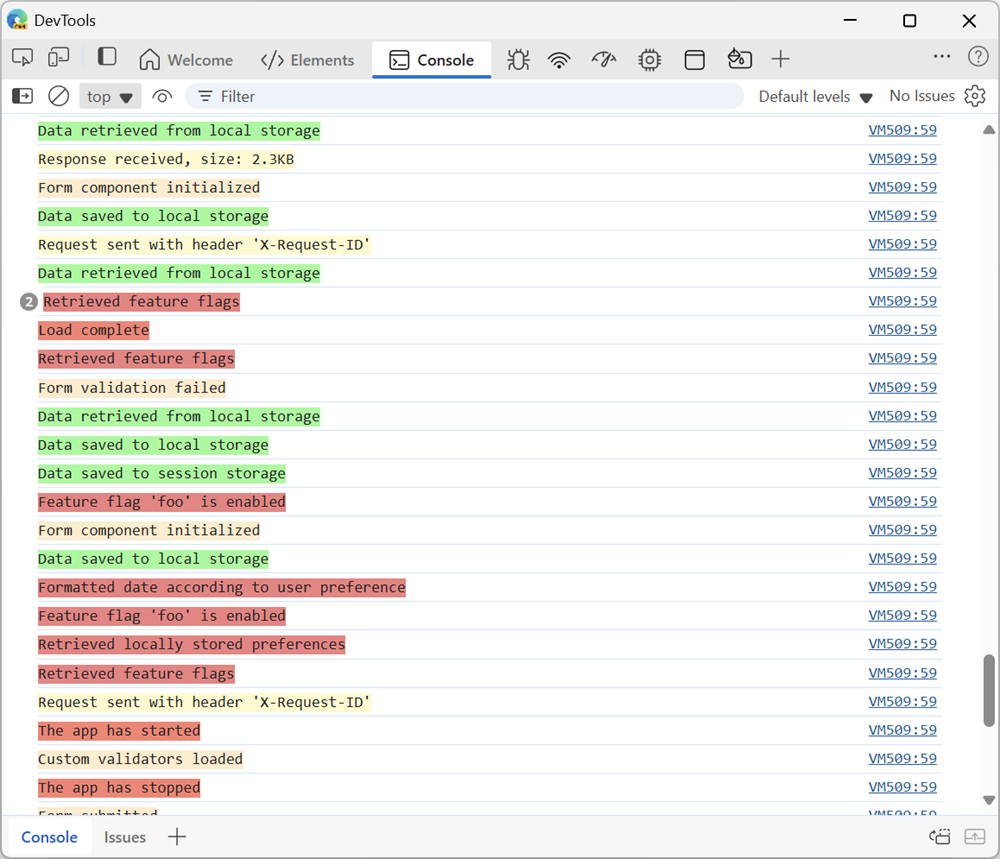 Applications are often made up of multiple subsystems or components, each with its own set of log messages. When you're debugging such an application, it might be hard to find the logs you're looking... Read more
 -
Find in files
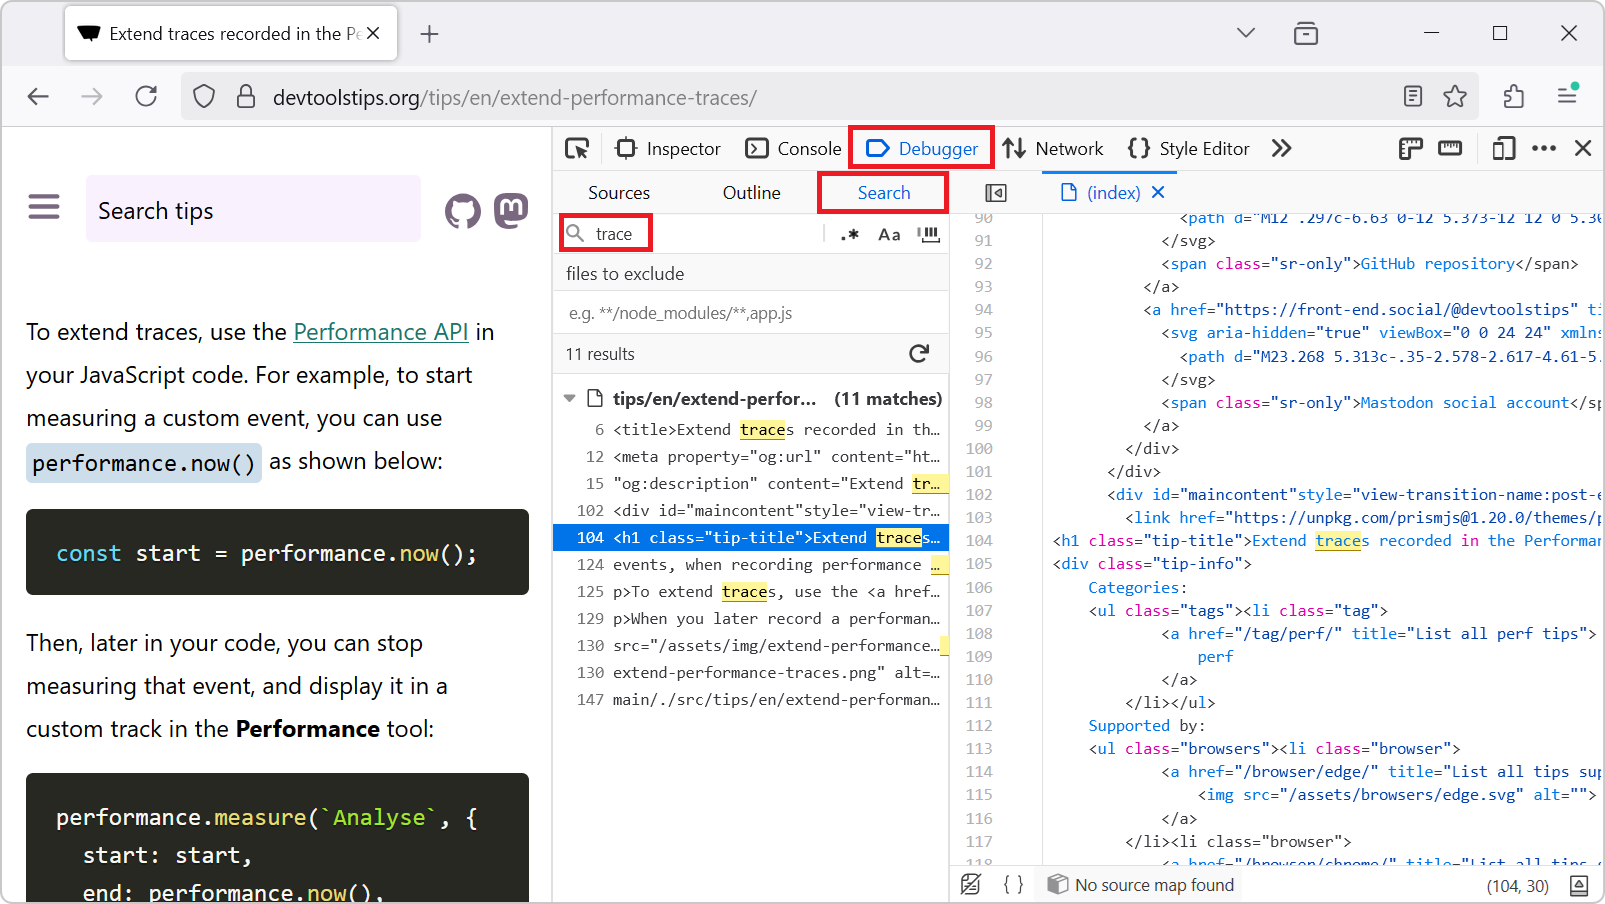 To find occurrences of a string in all of the files of the webpage you are inspecting, for example to find where a specific CSS class is defined, or where a specific JavaScript API is used: In Firef... Read more
 -
Extend traces recorded in the Performance tool with your own custom data
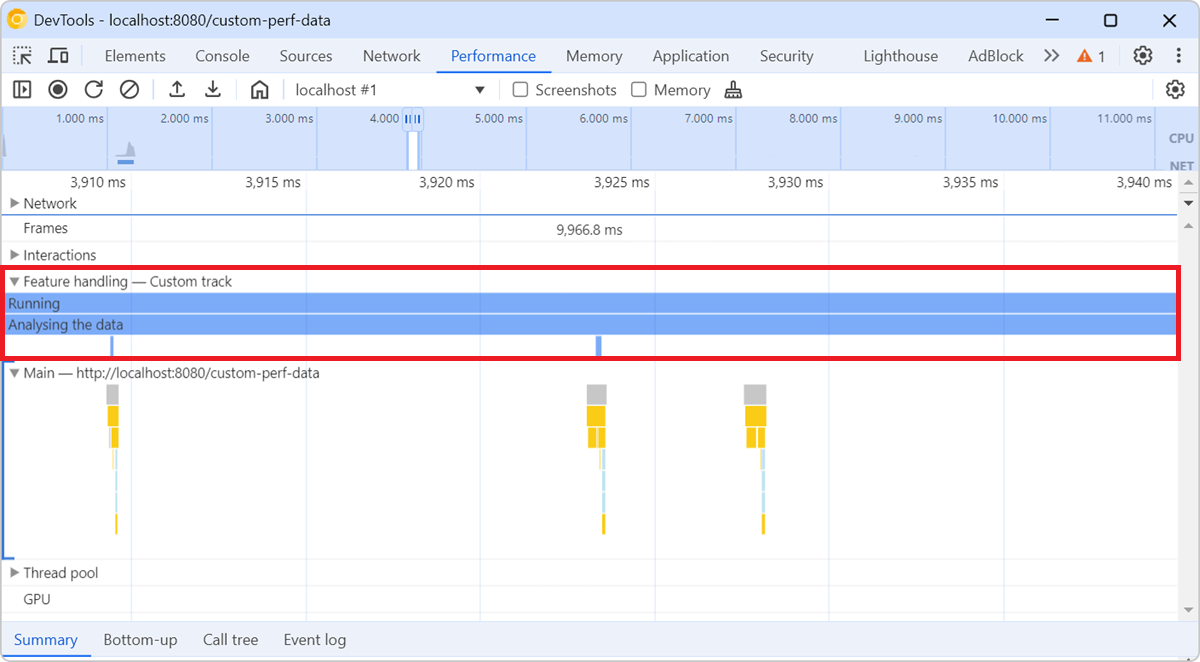 The Performance tool lets you add custom tracks with your own custom events, when recording performance traces. This is useful to surface your own performance data, which might not map directly to the... Read more
 -
Visualize a webpage's memory usage during a performance recording
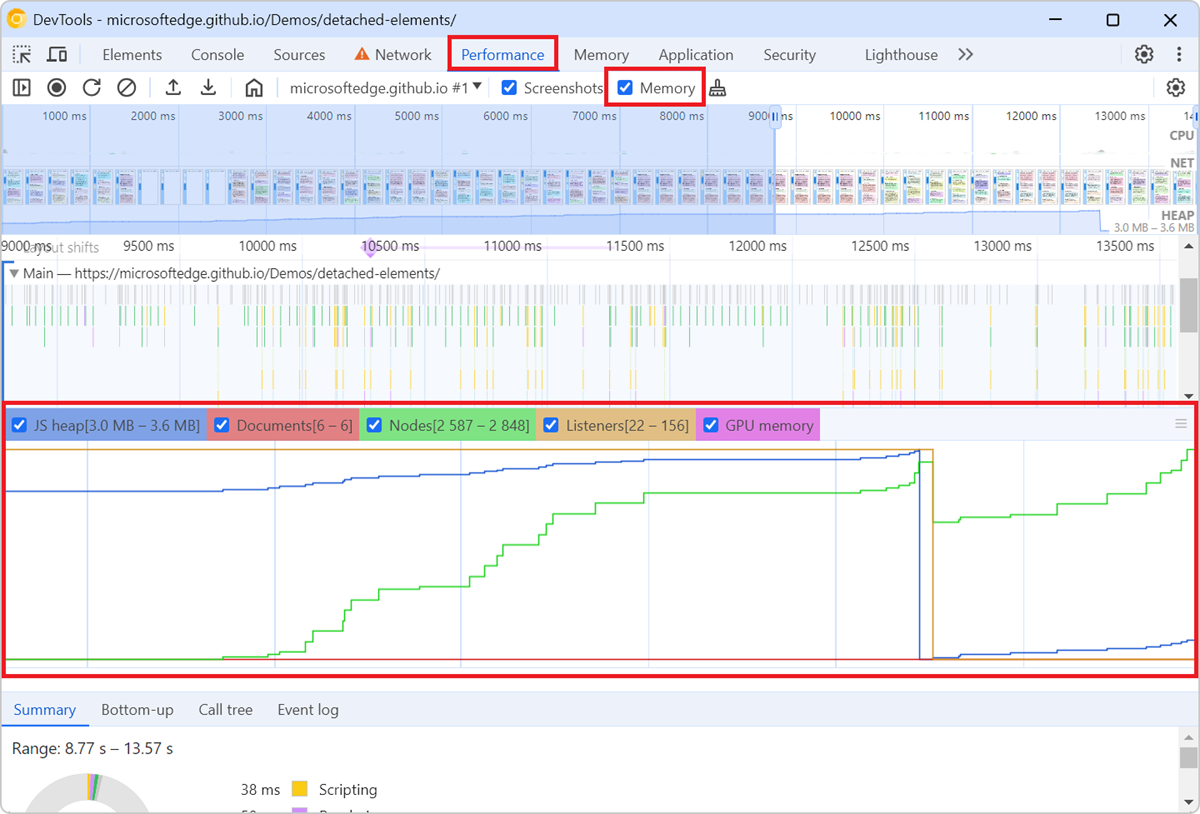 To check how much memory a webpage consumes over the time of a specific user scenario, and to identify potential memory leaks, you can use the Memory tool in Chrome or Edge DevTools with the Memory op... Read more
 -
Override source files to test changes in the browser
It can be helpful to make quick changes to the source code that a site uses, especially when debugging a site in production. For example, if you suspect that a bug is caused by a specific line of code... Read more
-
Override HTTP response headers
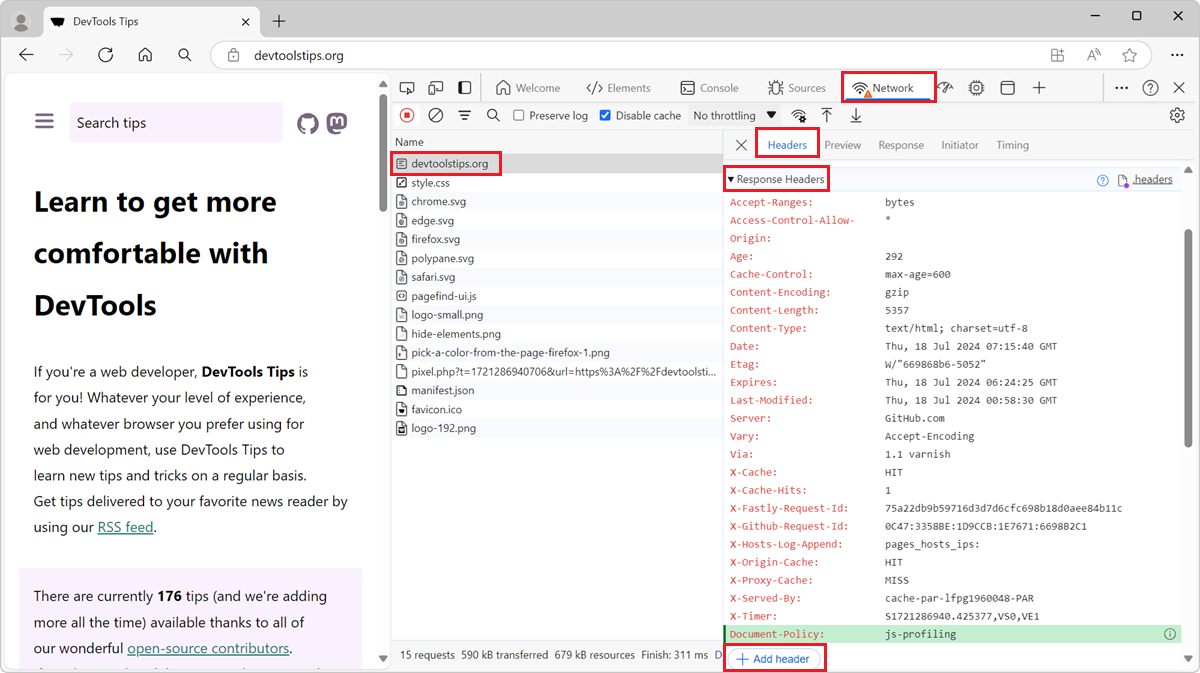 With DevTools, you can override the response headers of a network request and test your website under different conditions. HTTP response headers are metadata sent by the server to the browser, along... Read more
 -
Hide elements from the page, without changing the layout
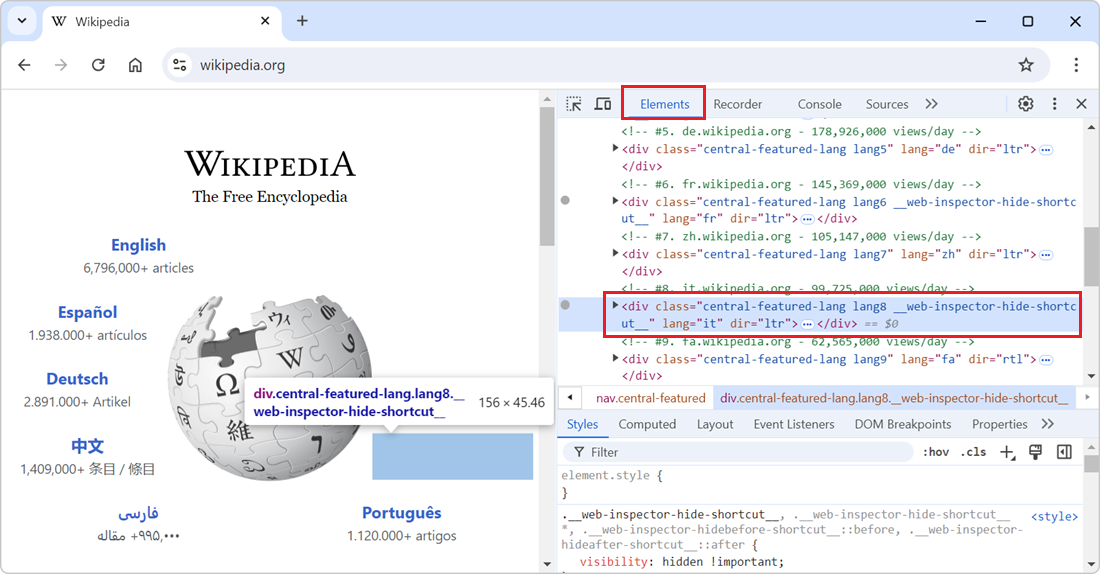 In the DevTools' Elements (or Inspector) tool, you can delete nodes from the DOM tree by selecting them in the tool and then pressing Delete or Backspace. While this is great to completely remove the... Read more
 -
Pick a color from the webpage, or the screen
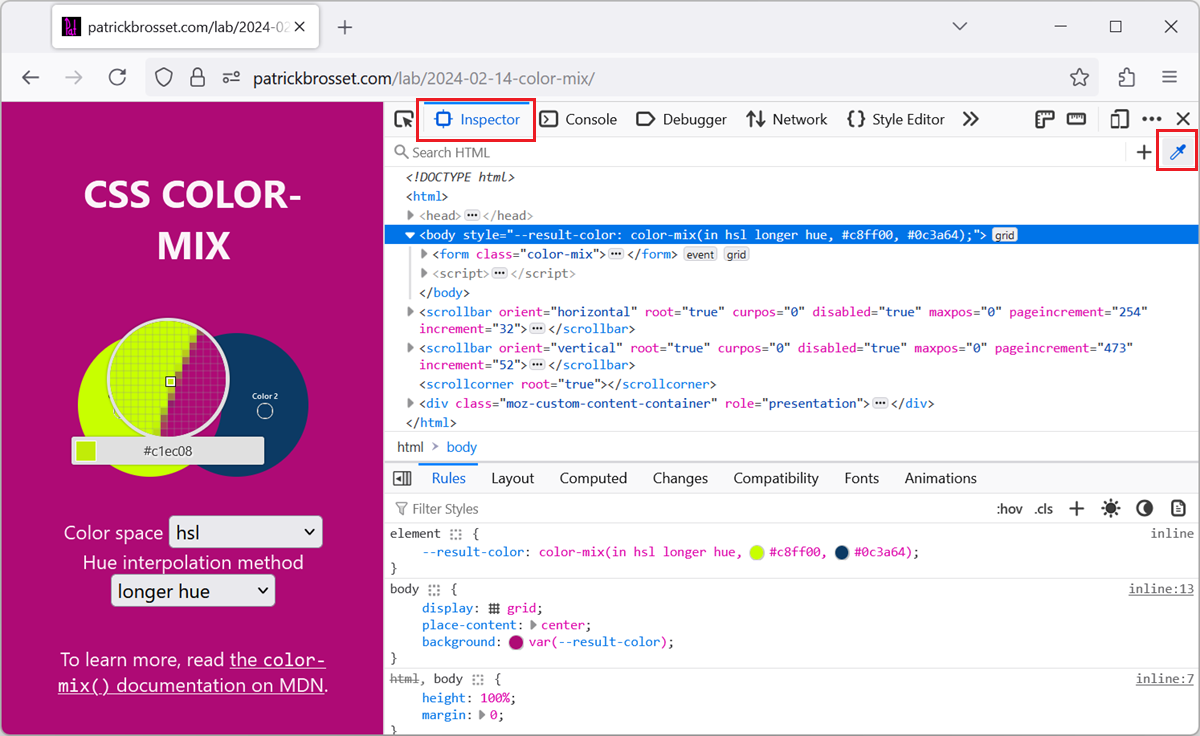 When working with the CSS of a webpage, from the Elements or Inspector tool, in DevTools, there may be times when you want to reuse a existing color from the webpage, or from the screen, but might not... Read more
 -
Highlight areas that the browser engine re-paints
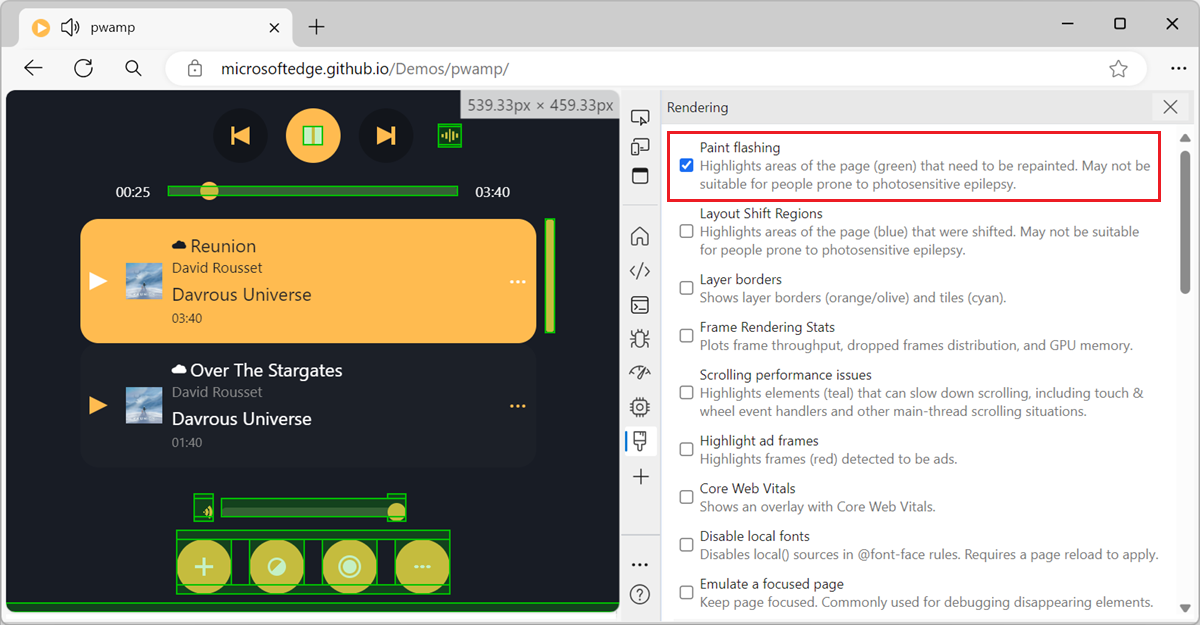 When you scroll through a webpage, or when parts of the webpage change, the browser engine sometimes needs to repaint parts of the page. The process of converting the layout and style information into... Read more
 -
Display the specificity of a CSS selector
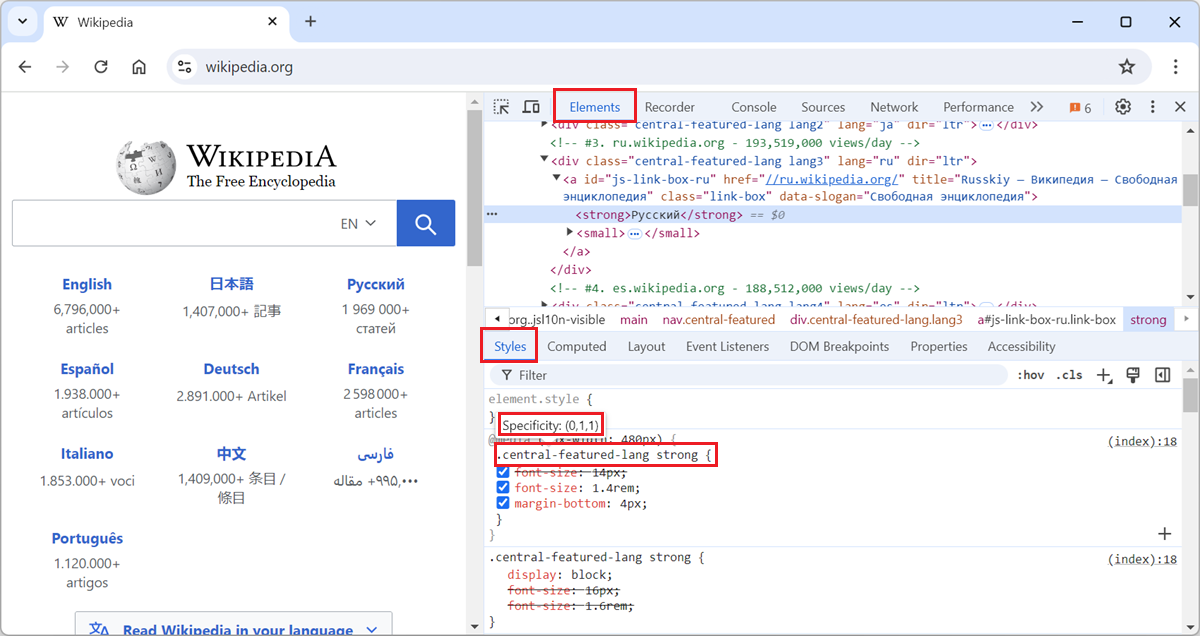 The specificity of a CSS selector is a score that the browser computes based on the different parts of the selector. It is used to determine which CSS rule takes precedence when multiple rules from th... Read more
 -
Copy an inline SVG image's source code
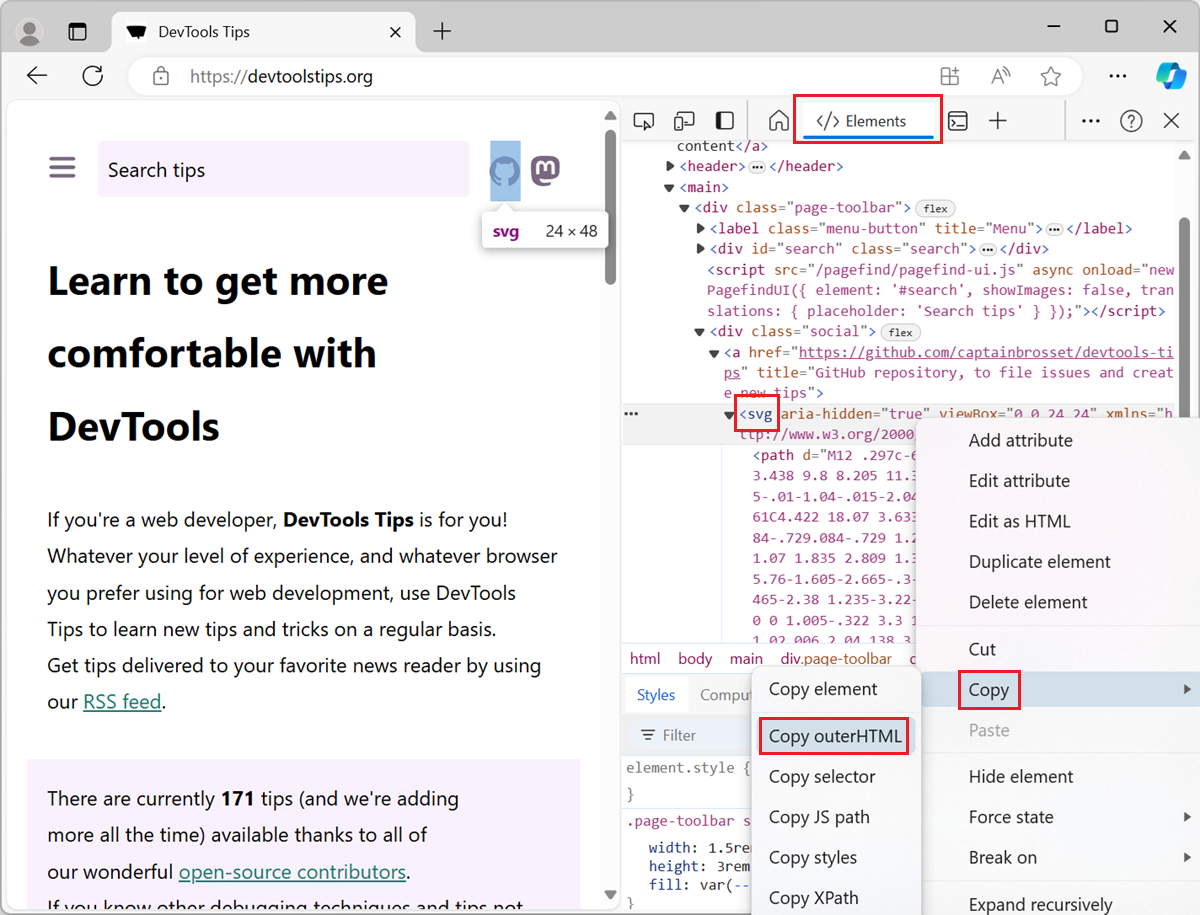 To copy the SVG source code of an SVG image that's embedded directly in the HTML of a webpage, use the Elements tool in DevTools (Inspector in Firefox). To open DevTools, right-click the SVG image i... Read more
 -
Disable all CSS styles on the page
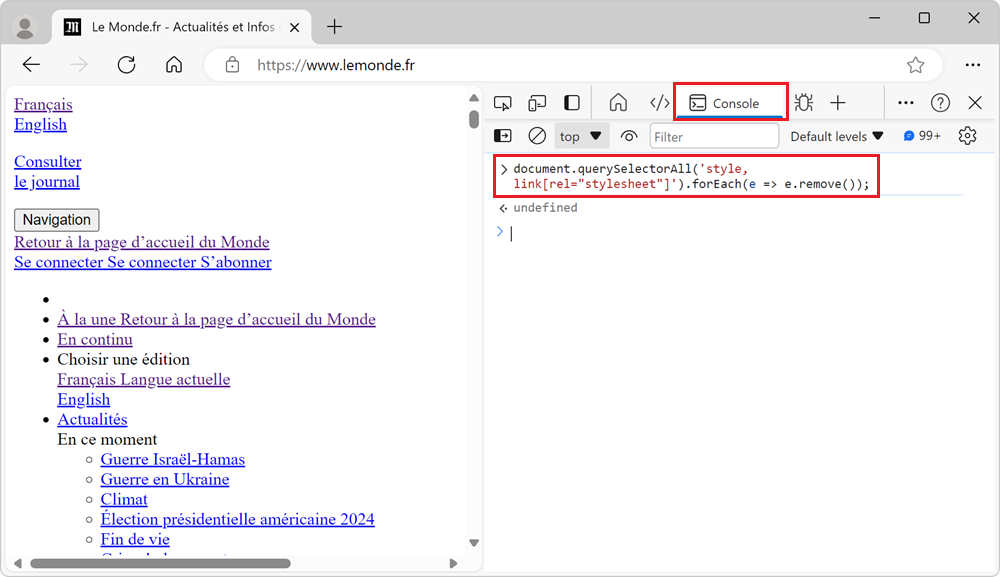 To remove all CSS styles on a webpage, for example to test the accessibility of a page when styles are disabled, or to verify the order in which content is displayed, you can use the techniques below.... Read more
 -
Find why a CSS property is overridden
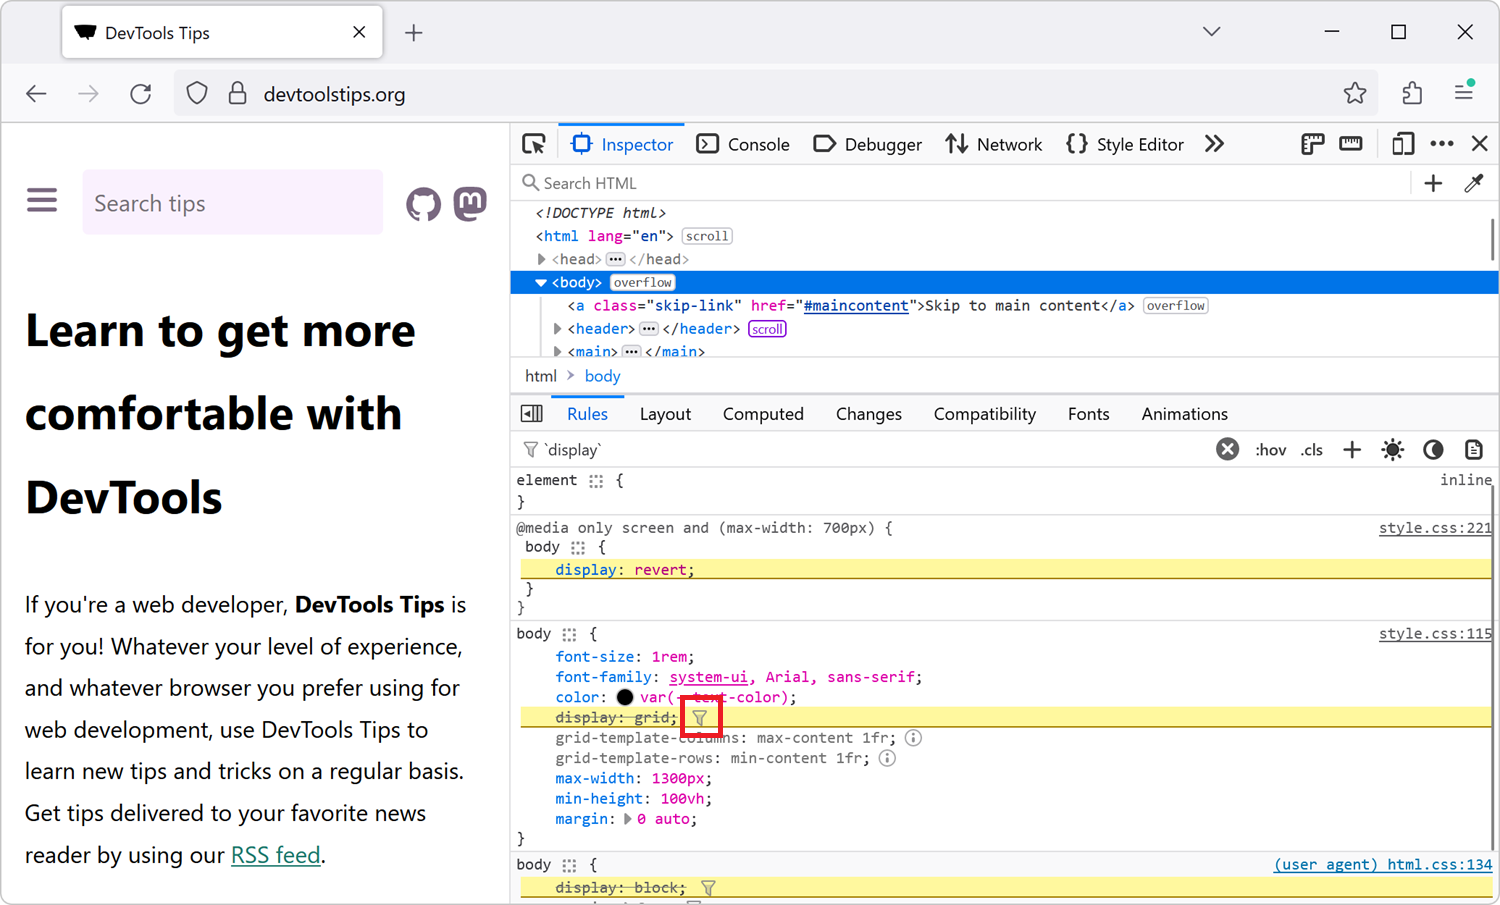 In CSS, the cascade plays a very important role in which CSS properties apply to an element. This key concept is not explained here, but you can learn more on MDN, at Cascade, specificity, and inherit... Read more
 -
See the accessibility tree
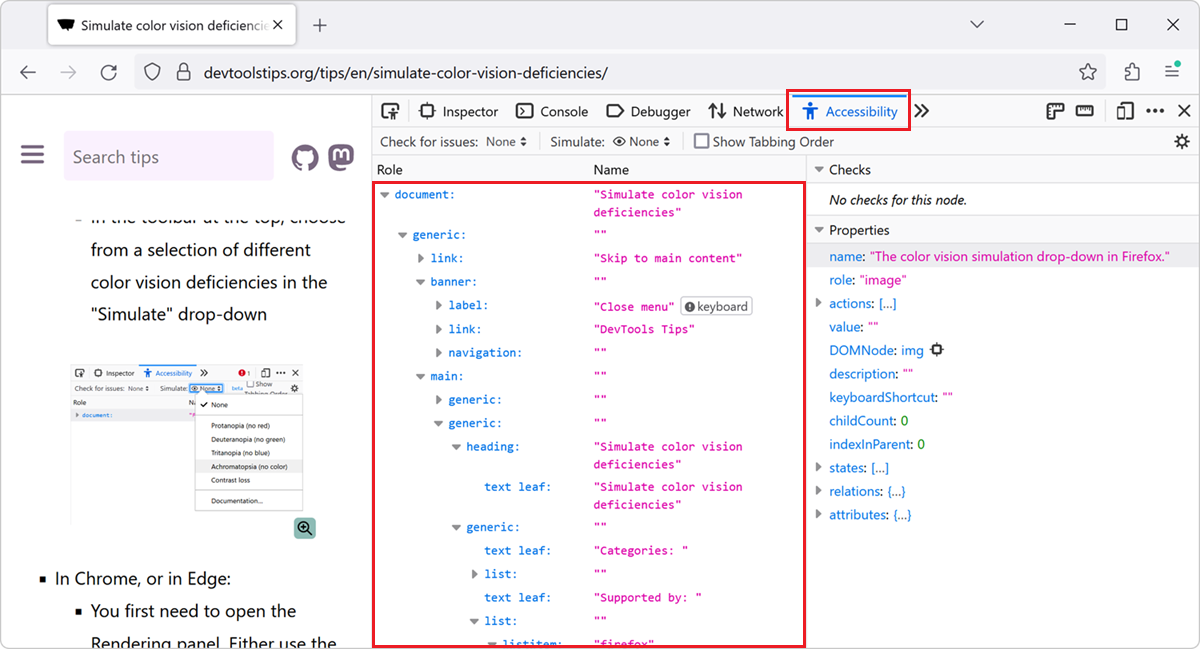 The accessibility tree is a representation of the structure of a web page that is used by assistive technologies such as screen readers. It is similar to the DOM tree, but it only includes the element... Read more
 -
Name evaluated files with the sourceURL pragma
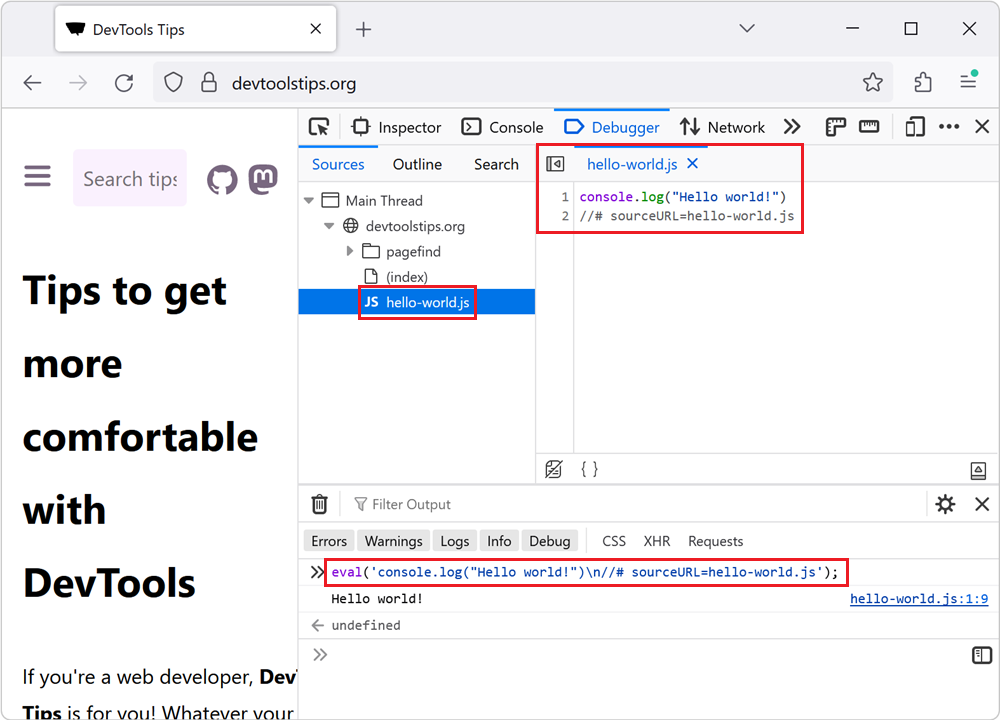 If you insert JavaScript code in a webpage by using the eval() function, or inline <script> tags, you can use the sourceURL pragma to give them a name in DevTools. For example, when using eval()... Read more
 -
Simulate the Window Controls Overlay feature for PWA
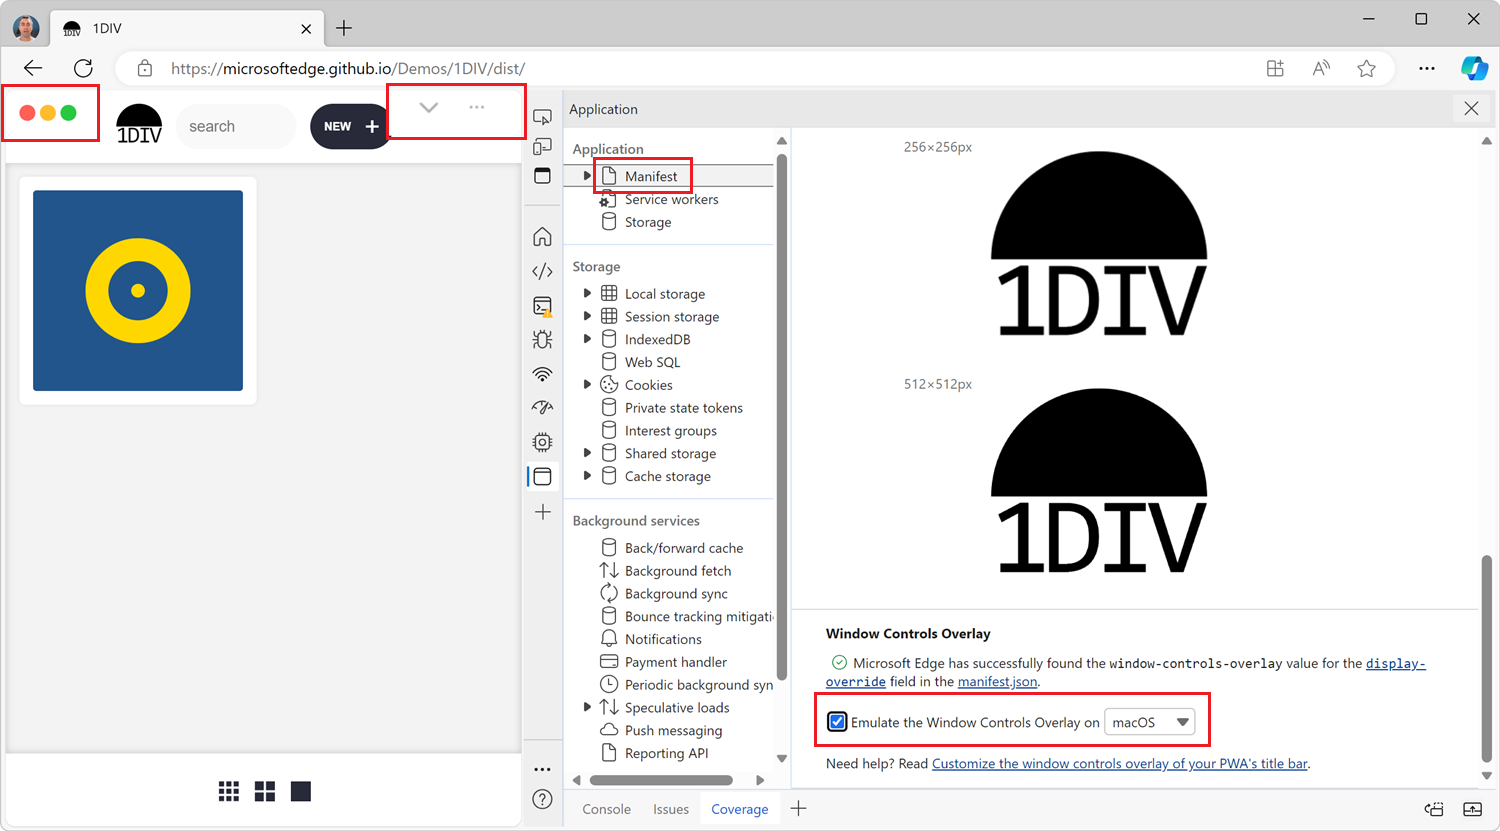 If you're building a desktop PWA, you might want to use the Window Controls Overlay (WCO) feature to make your app look more native. With WCO, you gain control over the entire surface area of the inst... Read more
 -
Inspect the user-agent DOM
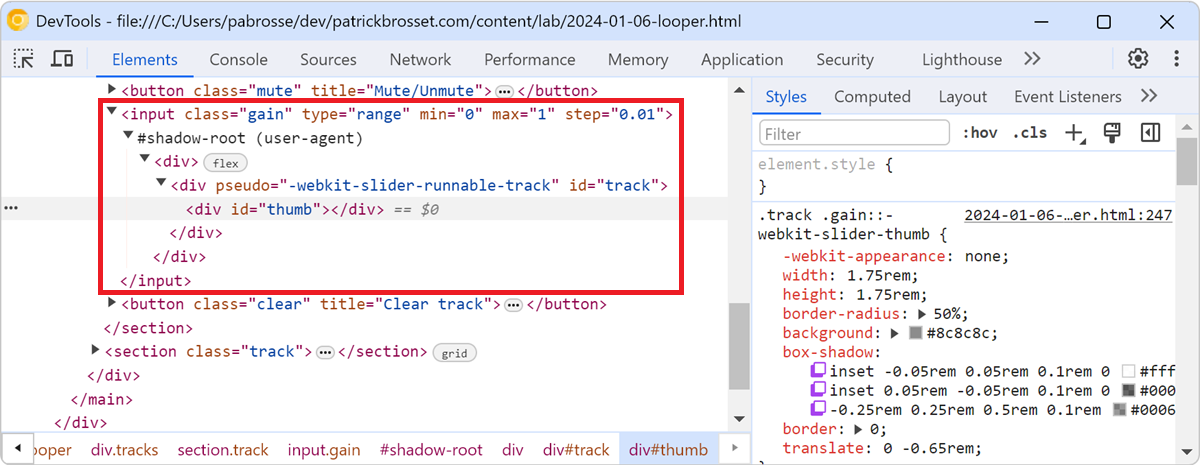 Browsers often add elements to the DOM of your web pages on top of the ones you, yourself, defined. For example, when you create a <video> element, the browser creates a bunch of nested DOM node... Read more
 -
Explain console errors by using artificial intelligence
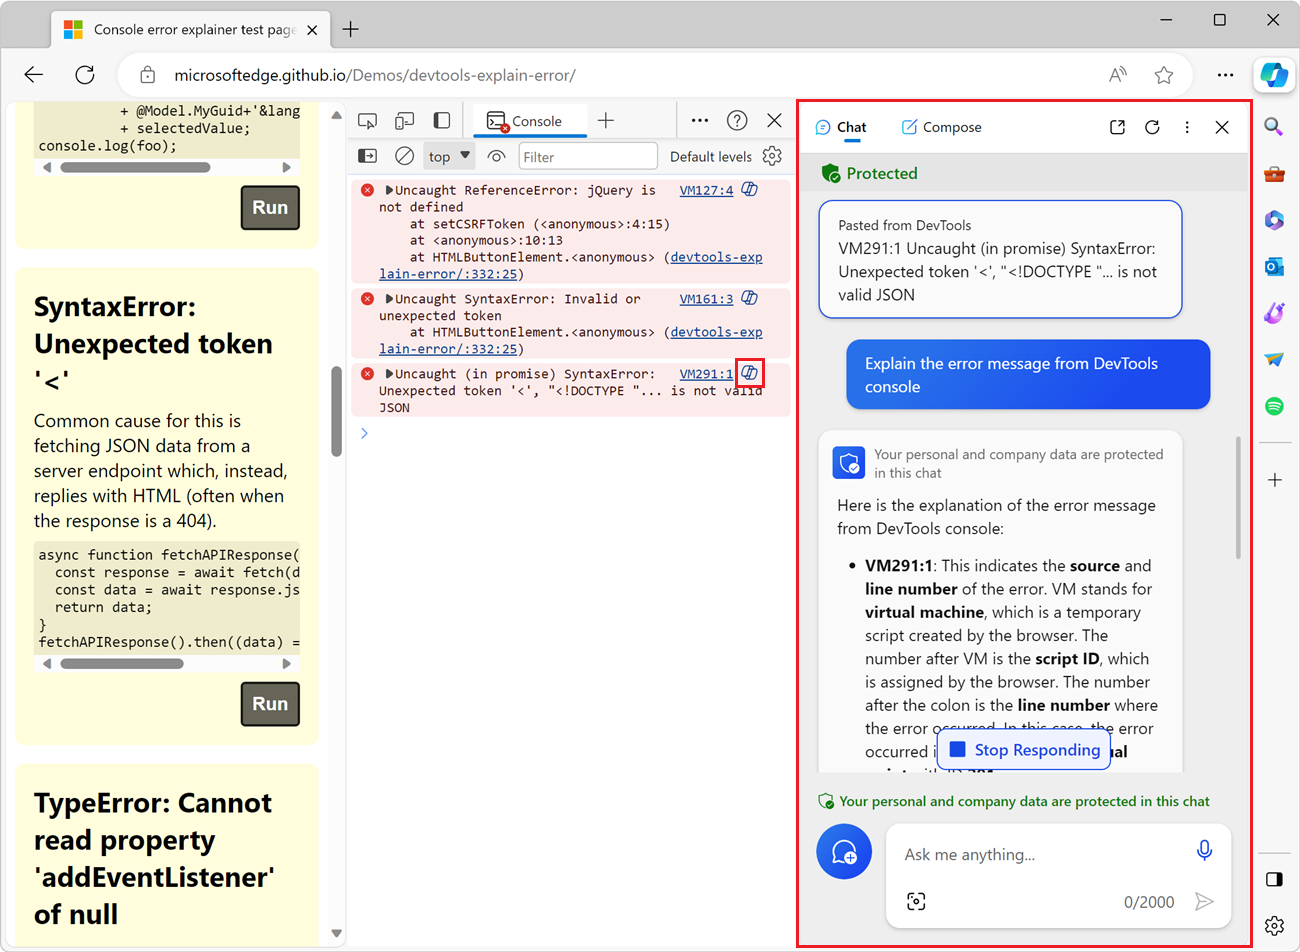 Edge DevTools lets use the Microsoft Copilot AI assistant to explain errors and warnings in the Console tool. Console errors can sometimes be hard to understand and fix. The large language models that... Read moreCategories: Supported by:
 -
Enable DevTools in Safari
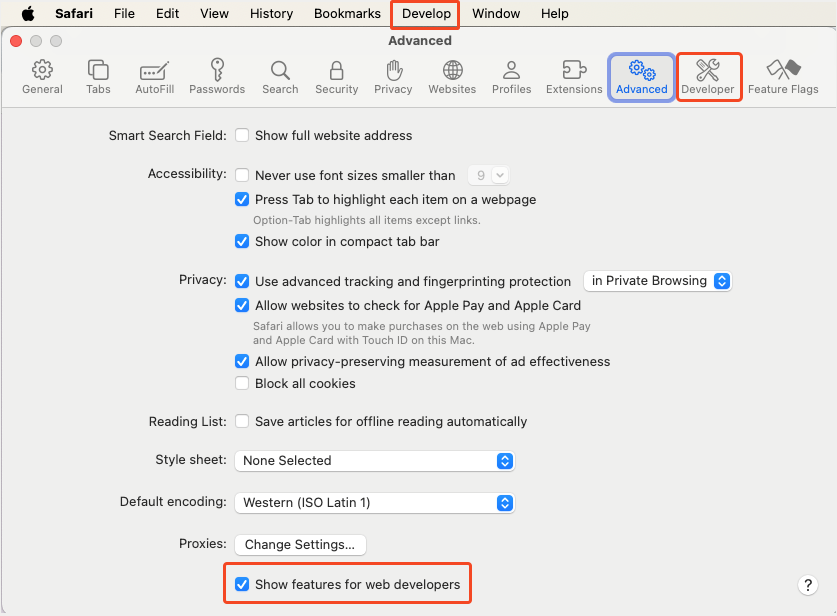 Unlike other browsers, Safari hides its DevTools (and other developer-related features) by default. That's actually good because 99% of the people using the browser are probably not web developers. If... Read moreCategories: Supported by:
 -
Block DevTools
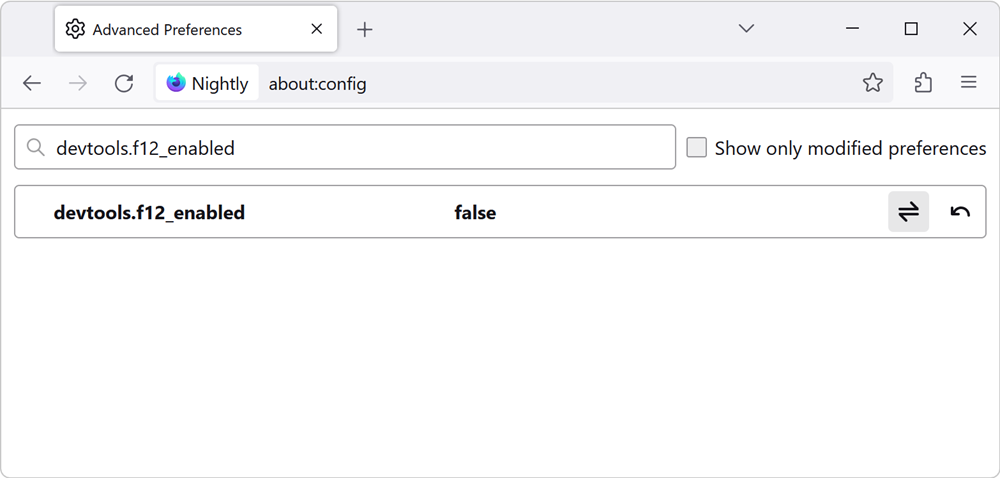 There are two levels to consider when talking about blocking (or disabling) DevTools in a browser: Disabling DevTools at the browser level. For example, if you have a browser for web development, and... Read more
 -
List all event listeners on the entire page
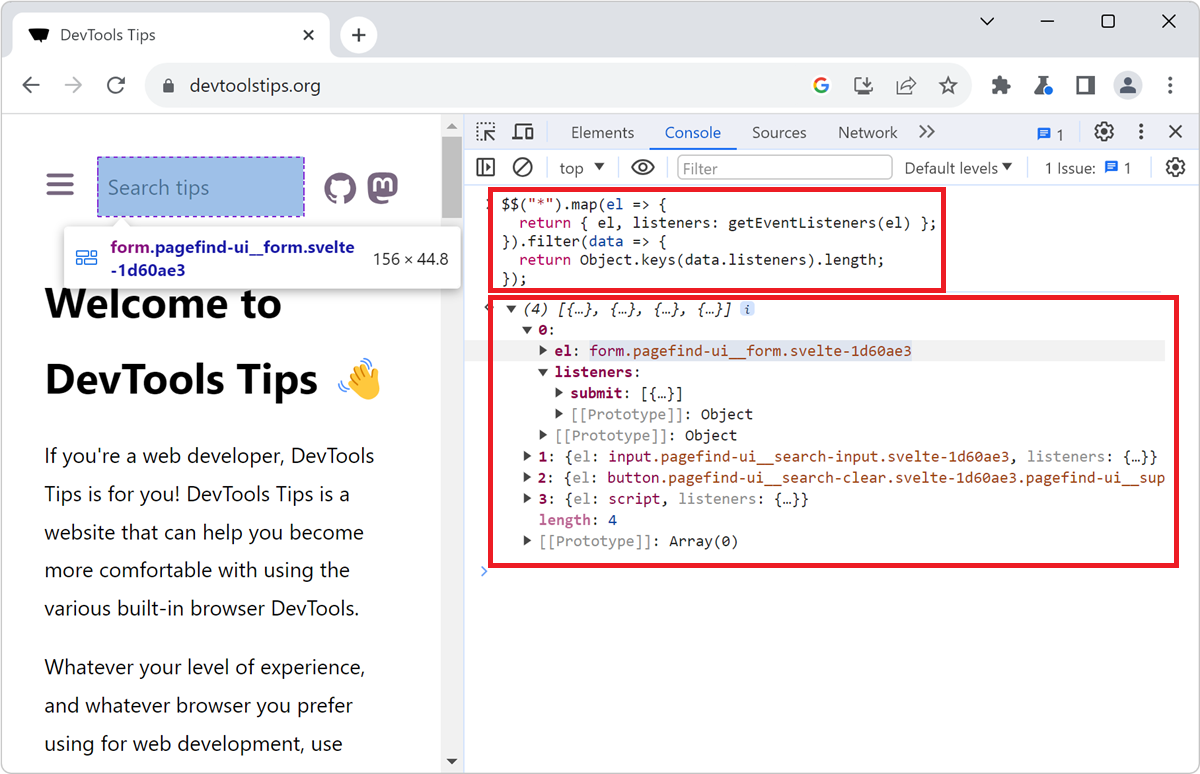 When you don't know a codebase, it might be hard to know where to get started, and what events are being listened to by which elements. The Console tool, in Chromium-based browsers, comes with a nice... Read more
 -
Debug popups that appear on hover
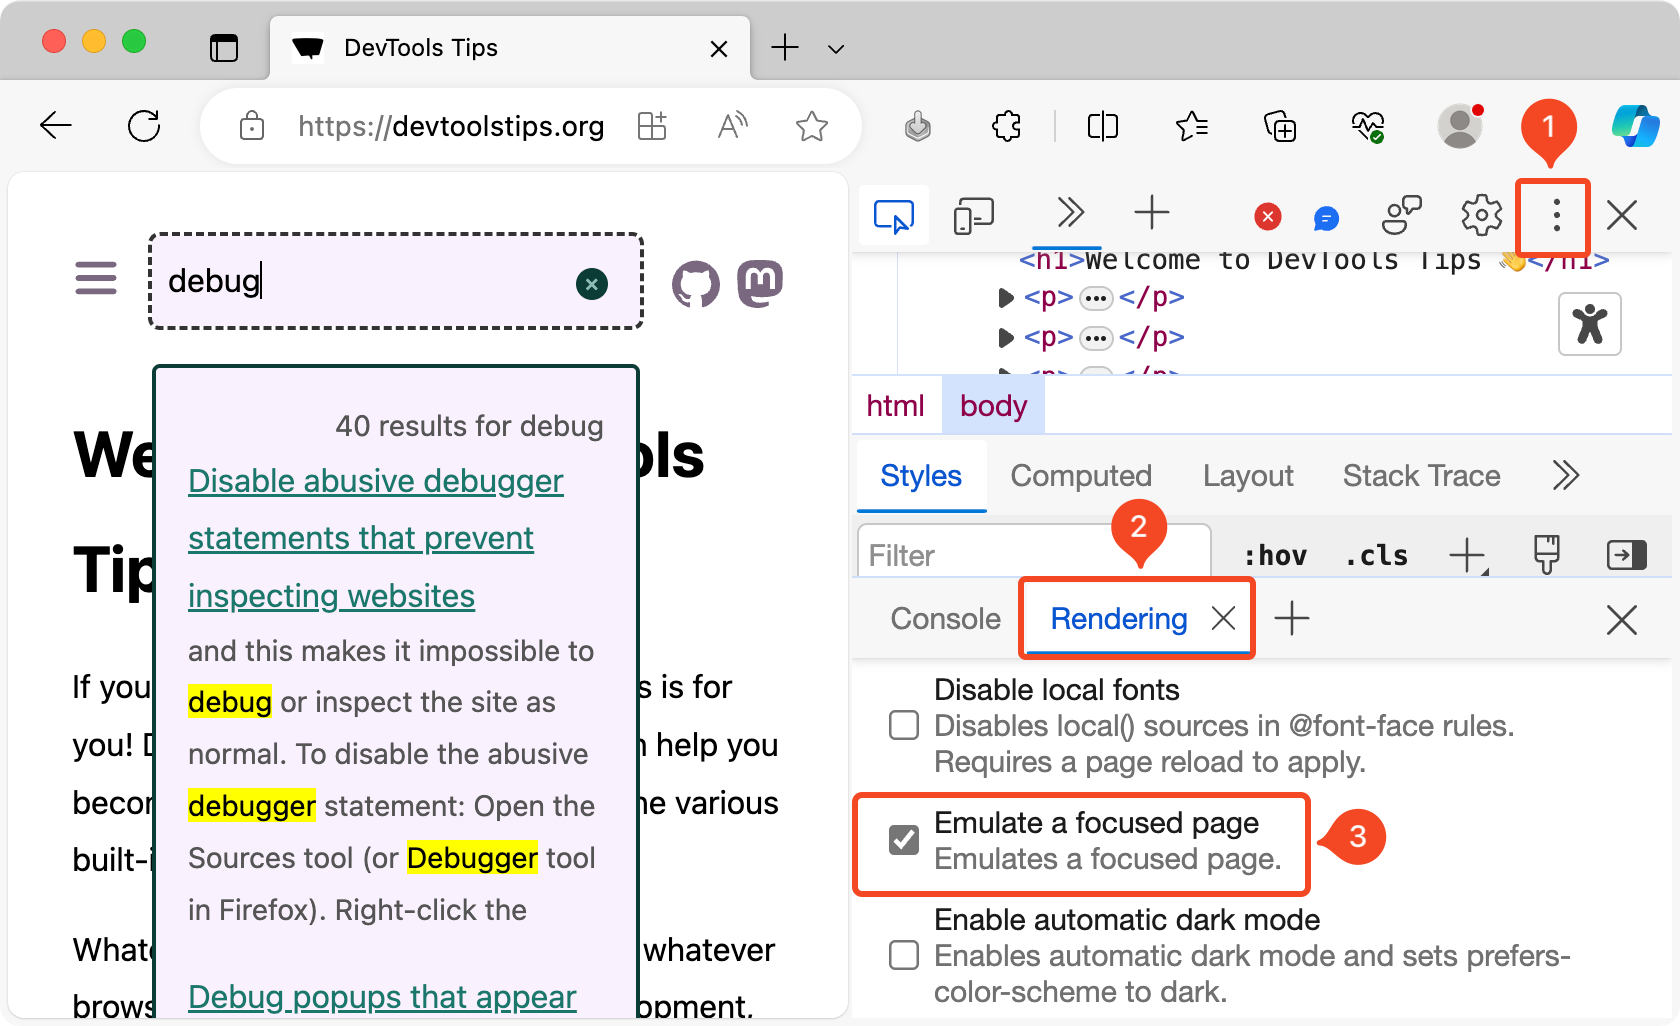 As described in Debug popups that appear on hover using JS and in Debug popups that appear on hover using the debugger statement, there are ways to debug popups that appear on hover using JavaScript.... Read more
 -
Force execution, skipping breakpoints, when paused
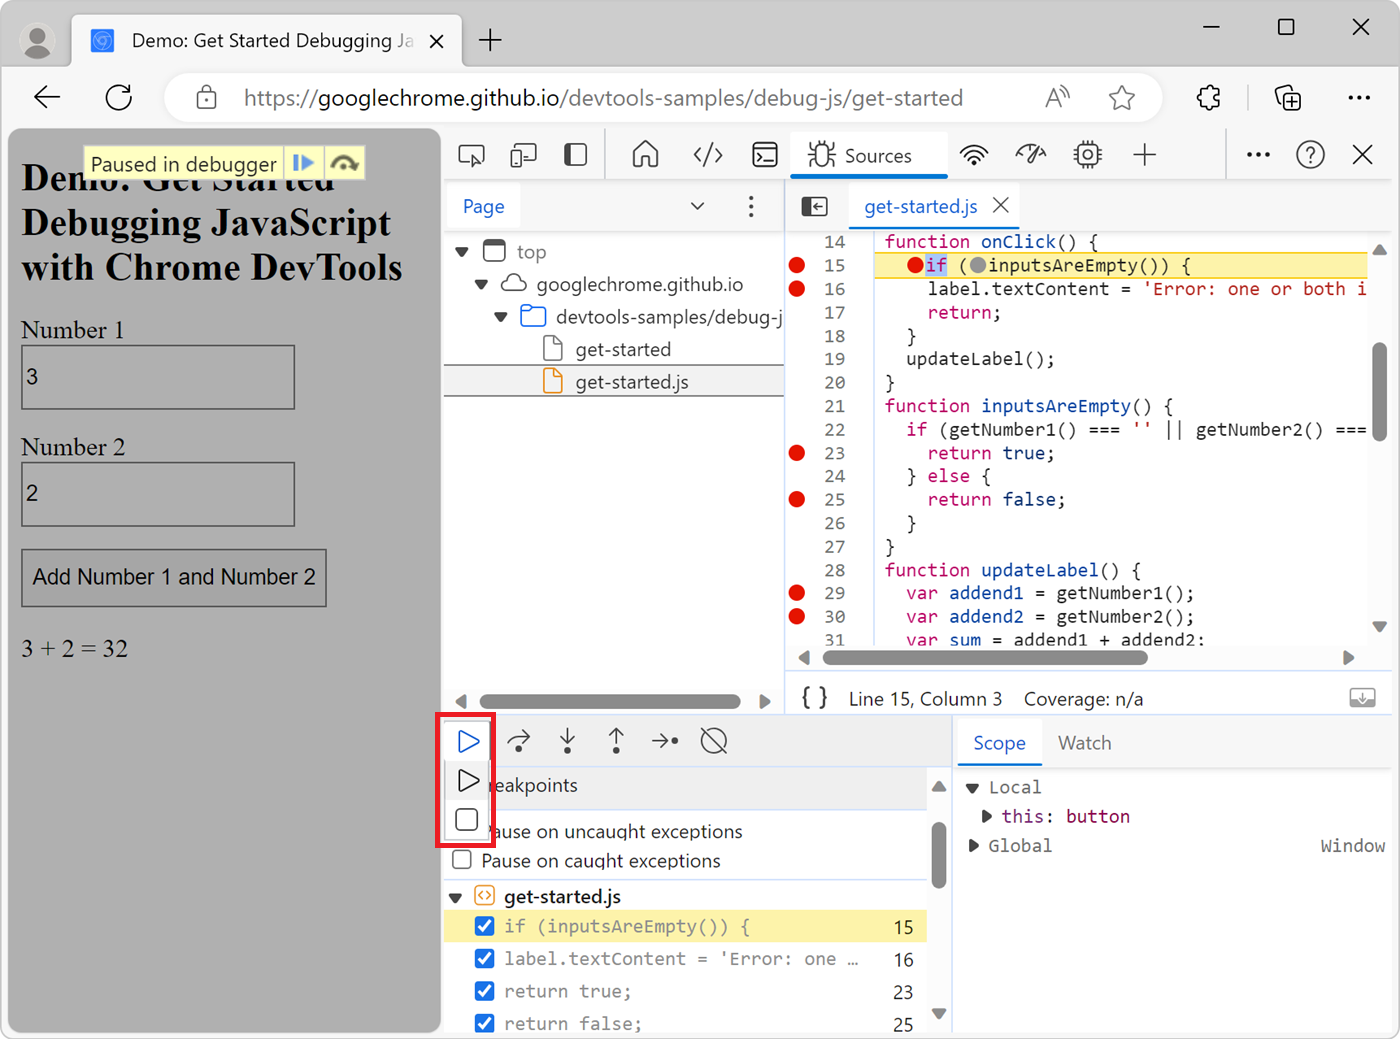 When using breakpoints to debug your JavaScript code, sometimes you end up setting many breakpoints in different functions. You might want to keep these breakpoints but not always pause at them. There... Read more
 -
See the viewport size
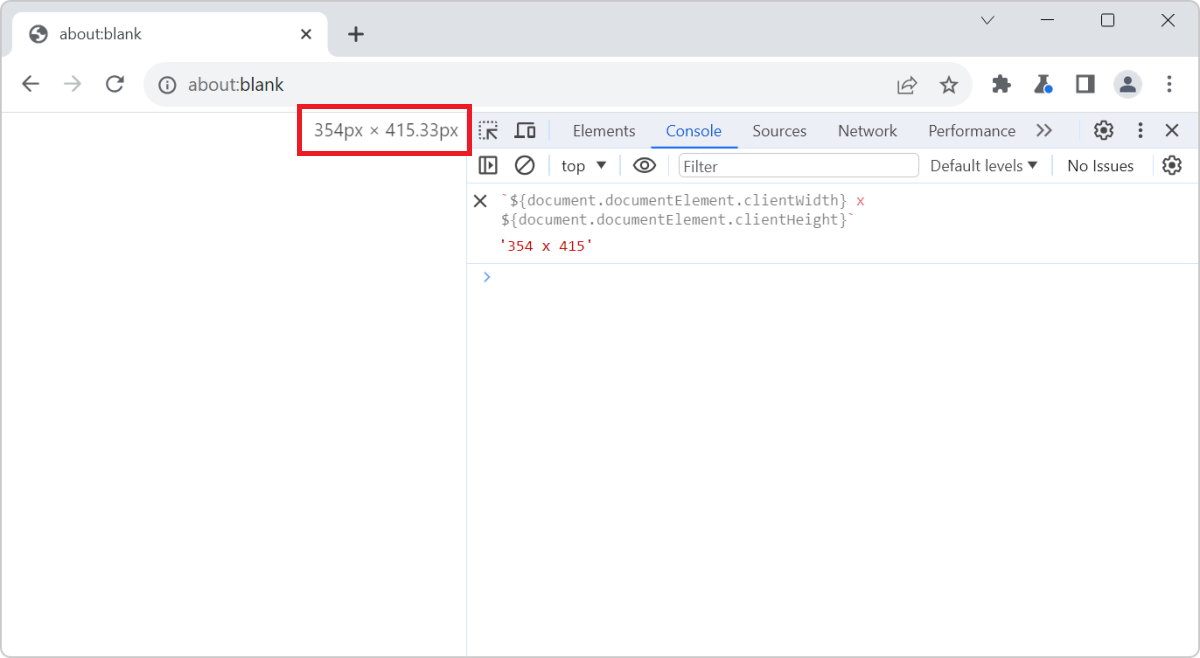 The size of the viewport that's used to render a webpage in a browser can be very important at times, such as when creating or debugging media queries. You can easily know what the current size of the... Read more